(P&I) The [New] Power Law & Volatility Smile
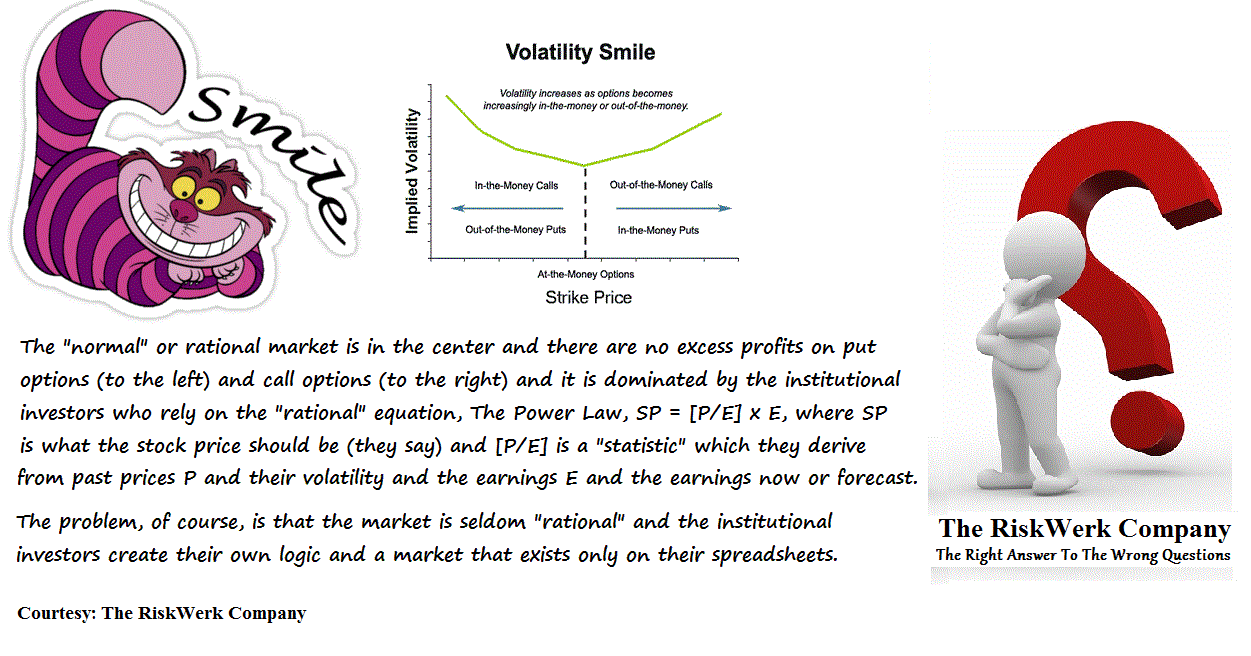
Figure 1: The “Volatility Smile” is much more expensive than you ever thought.
Essay. The “volatility smile” is common in the options pricing model (Black-Scholes 1973 and its many variants) and it is created by strong investment outside of the “rational market”.
Investors correct for it by developing an “implied volatility” which is calculated from the actual prices for which they can buy and sell these stocks (the underlying) and, therefore, they shoe-horn this market into their “rational market” and assume that these investors will eventually behave “rationally” (like them) or pay a price for their “irrational” behavior; please see Figure 1 on the right.
But that’s where we have a problem because the “volatility smile” is much more expensive than just a “fringe benefit” and much more expensive than you ever thought and that is our problem for today because the word “rational” means only one thing for us – don’t lose your money if you’re going to spend it on investments to get an income – we want 100% capital safety and we don’t take any capital risks (period) which the “rational market” invites us to buy.
Our domain is the World Trade Portfolio which has over 1700 mostly large capitalization companies with a current market value of USD$47 trillion in a dozen markets which changes every day by about 2% or $1 trillion that is in the float between stocks and cash as the investors shift their positions on new money or new information and liquidity concerns possibly triggered by volatility or “surprise” or just a need to pay their bills.
But it’s only a matter of our budget that we don’t invest in all of them, all of the time in the (B)-class portfolio as long or short holdings and we don’t really need “options” (as above) to invest in these companies with 100% capital safety and our returns are as predictable in the “rational market” as in any other market and average about +30% per year come rain or shine in most markets.
That would be about 20% or more per year than you’re getting for “rational behavior”.
The Rational Market
The equation that defines the “rational market” is called The Power Law and it’s just SP = [P/E] × E where P is the ambient stock price and E is the earnings per share and SP is the expected stock price.
It is also equivalent to SP = [V/E] × E per share where V is the market value of the company and E is now its total net earnings per year, and in both cases, we have used the square-bracket, [P/E] or [V/E], to indicate that there is some “statistics” going on (such as “mean reversion” or the Capital Assets Pricing Model (CAPM) which makes the same assumptions) because the SP so-defined is not today’s stock price but what the investors think that it should be in a rational market.
But Mr. Keynes said long ago (1936) that “the market can be irrational much longer than you can remain solvent” and several generations of investors have tried to change that equation with the Power Law and reduce the market to an analysis of its “volatility”.
And another astute investor and observer of human behavior, John von Neumann, has said that “volatility is not an investment risk; it is volatility (sic)” (1943) and if we put those two facts together – and they are facts and well-known and not just hypotheses – we have to conclude that investors today don’t have any idea of what they should pay for a stock or its earnings or an income.
All that they know are the price and quantity at which they can buy and sell them today to other investors for which reasons they also don’t know nor whether they’re selling them for a profit or a loss because, after all, there is a difference of opinion or other reasons which make the exchange possible between cash now and one stock or another later.

The Rational Investor’s Fishing Boat at “Mean Reversion” (with repairs as needed)
And that is, indeed, a sad situation affecting multiple trillions of dollars of investments and it makes a large part of the market transparent to us as if it were being being run by robots on remote control which know the price of everything but the value of nothing (Oscar Wilde 1892).
And that should be concerning because your pension plans and sovereign wealth funds are fighting daily with “volatility” and “surprise” when their real issue is with liquidity – can they remain invested and still expect to pay their bills on time – and they don’t know the answer to that question and they haven’t solved that problem with volatility management but they’ve floated it into an “impressive” fishing boat of their own design.
Of course, we wouldn’t mention that either, that we don’t know what your income is going to be because of the risk, you know, the risk, if we didn’t have a solution and the above results in the (B)-Class Portfolio (which we’ll detail below) suggest that about 50% of the market returns with no capital risk at all are not going to the investors who own the money and bought the risk but to New York which has a roughly 50% “profit margin” on new money from “new sales”, so to speak, that you’re not getting.
In other words, New York is keeping about 50% of the investment returns that you’re not getting and that could be explained by the oldest “Power Law”, Ohm’s Law (1827), P = V × I for which a high voltage, V, or “volatility”, and a low current, I, or a low sense of risk aversion (please see below), will likely kill you, but the reverse, not so much.
The Price of Everything
Our benchmark portfolio is the full market (B)-Class Portfolio in over 840 companies in the World markets each of which has a current market value of more than USD$10 billion and that portfolio has returned an average of +17% per year since 2012 and more than doubled our net worth (+120%) and an average of +20% per year since 2012 if we also used the short portfolio and, in both cases, with no capital risk at all pro forma and with minimal use of the margin account and lots of idle cash to handicap those results which we’ll need to explain (please see below).
On the other hand, the World market has increased by only +65% in capital gains since 2012 and an average of only +10% per year during that time and few of the “rational investors” will be able to claim even those numbers.
In other words, the “rational market” earned less than half of the World market returns in the (B)-Class Portfolio and the “rational investors” will blame the “market” if they get even less than that and, of course, the “rational investors” are guaranteed to have a hard time keeping what they have earned if they stay in the “rational market” because both their gains and their losses are built-in to the “volatility” equation (the Power Law, as above) and “surprise” which is actually not surprising at all; please see the illustrations below for more detail.
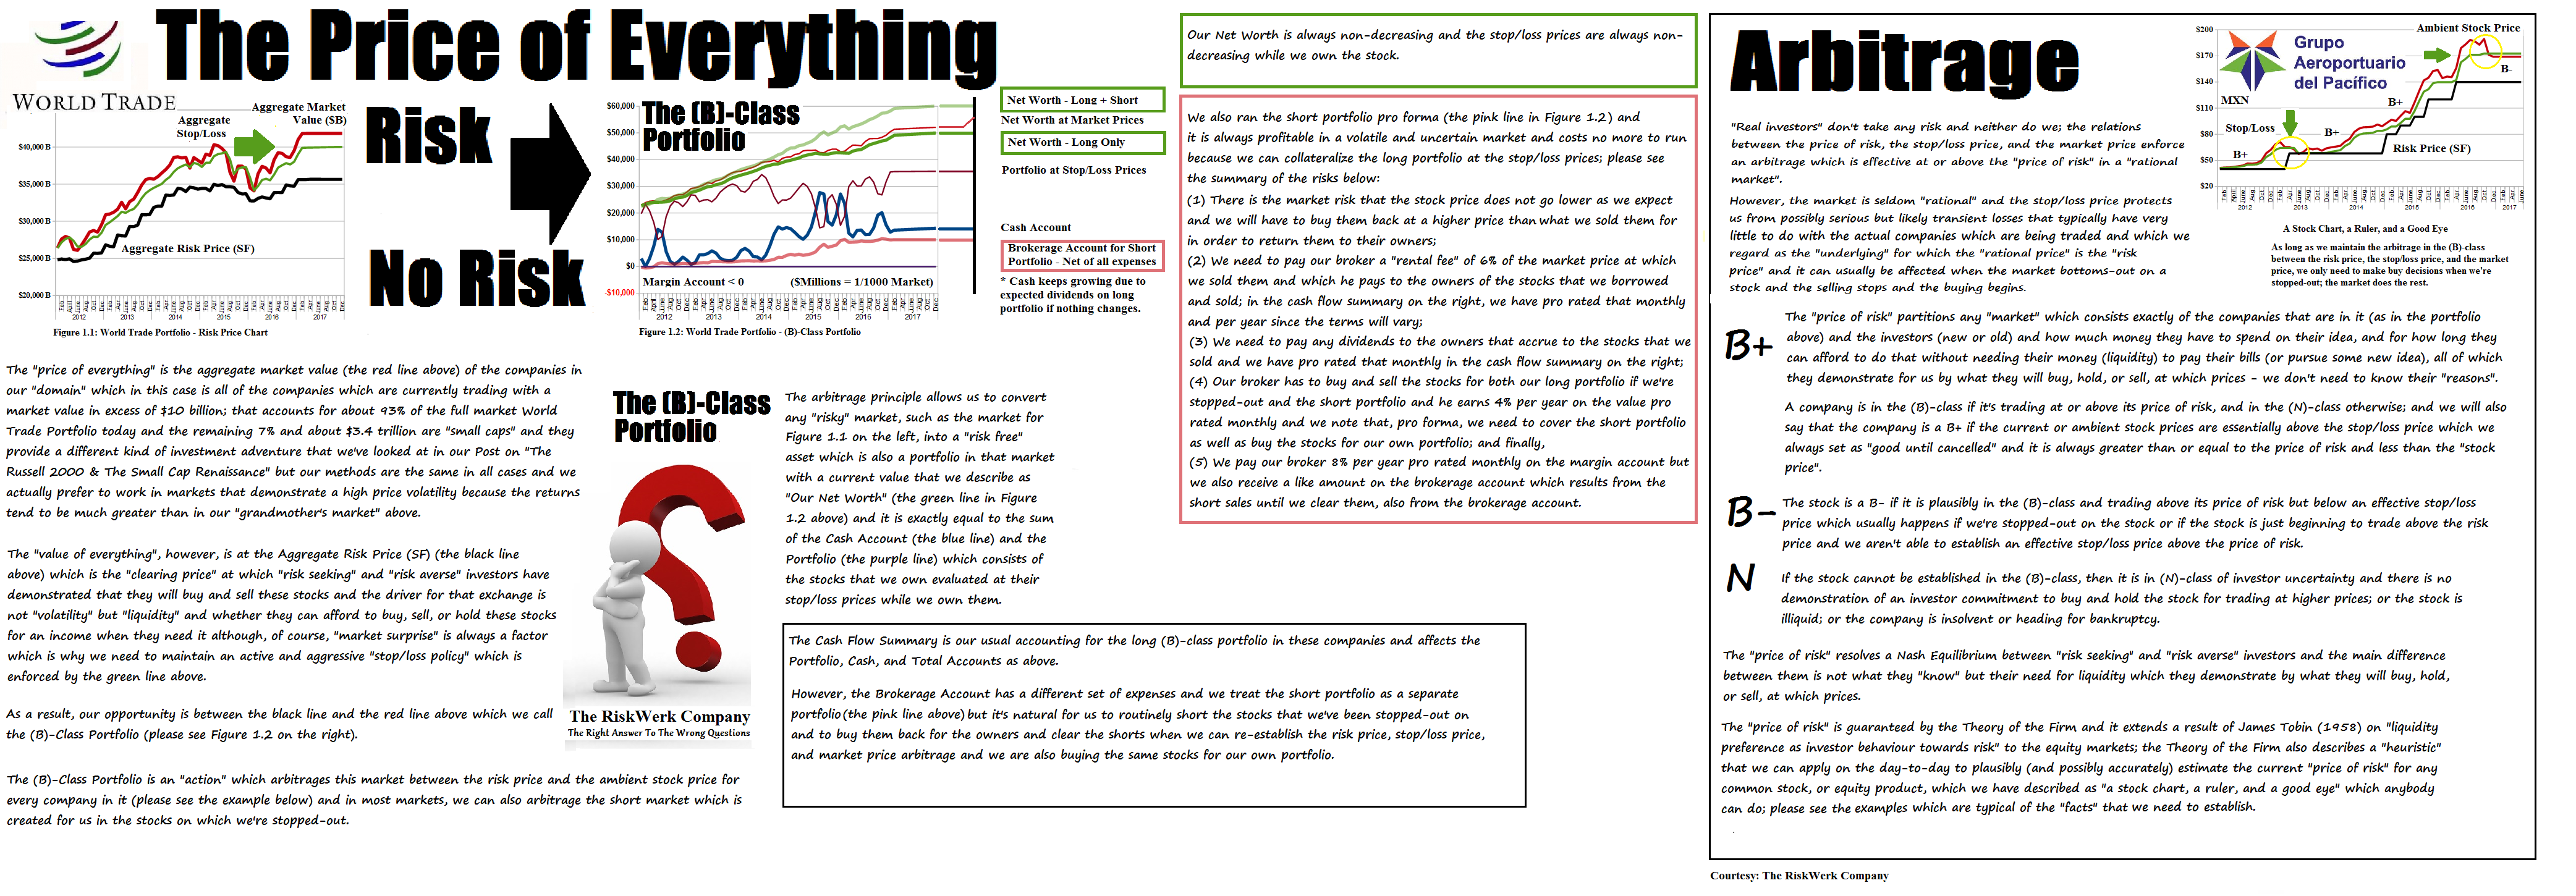
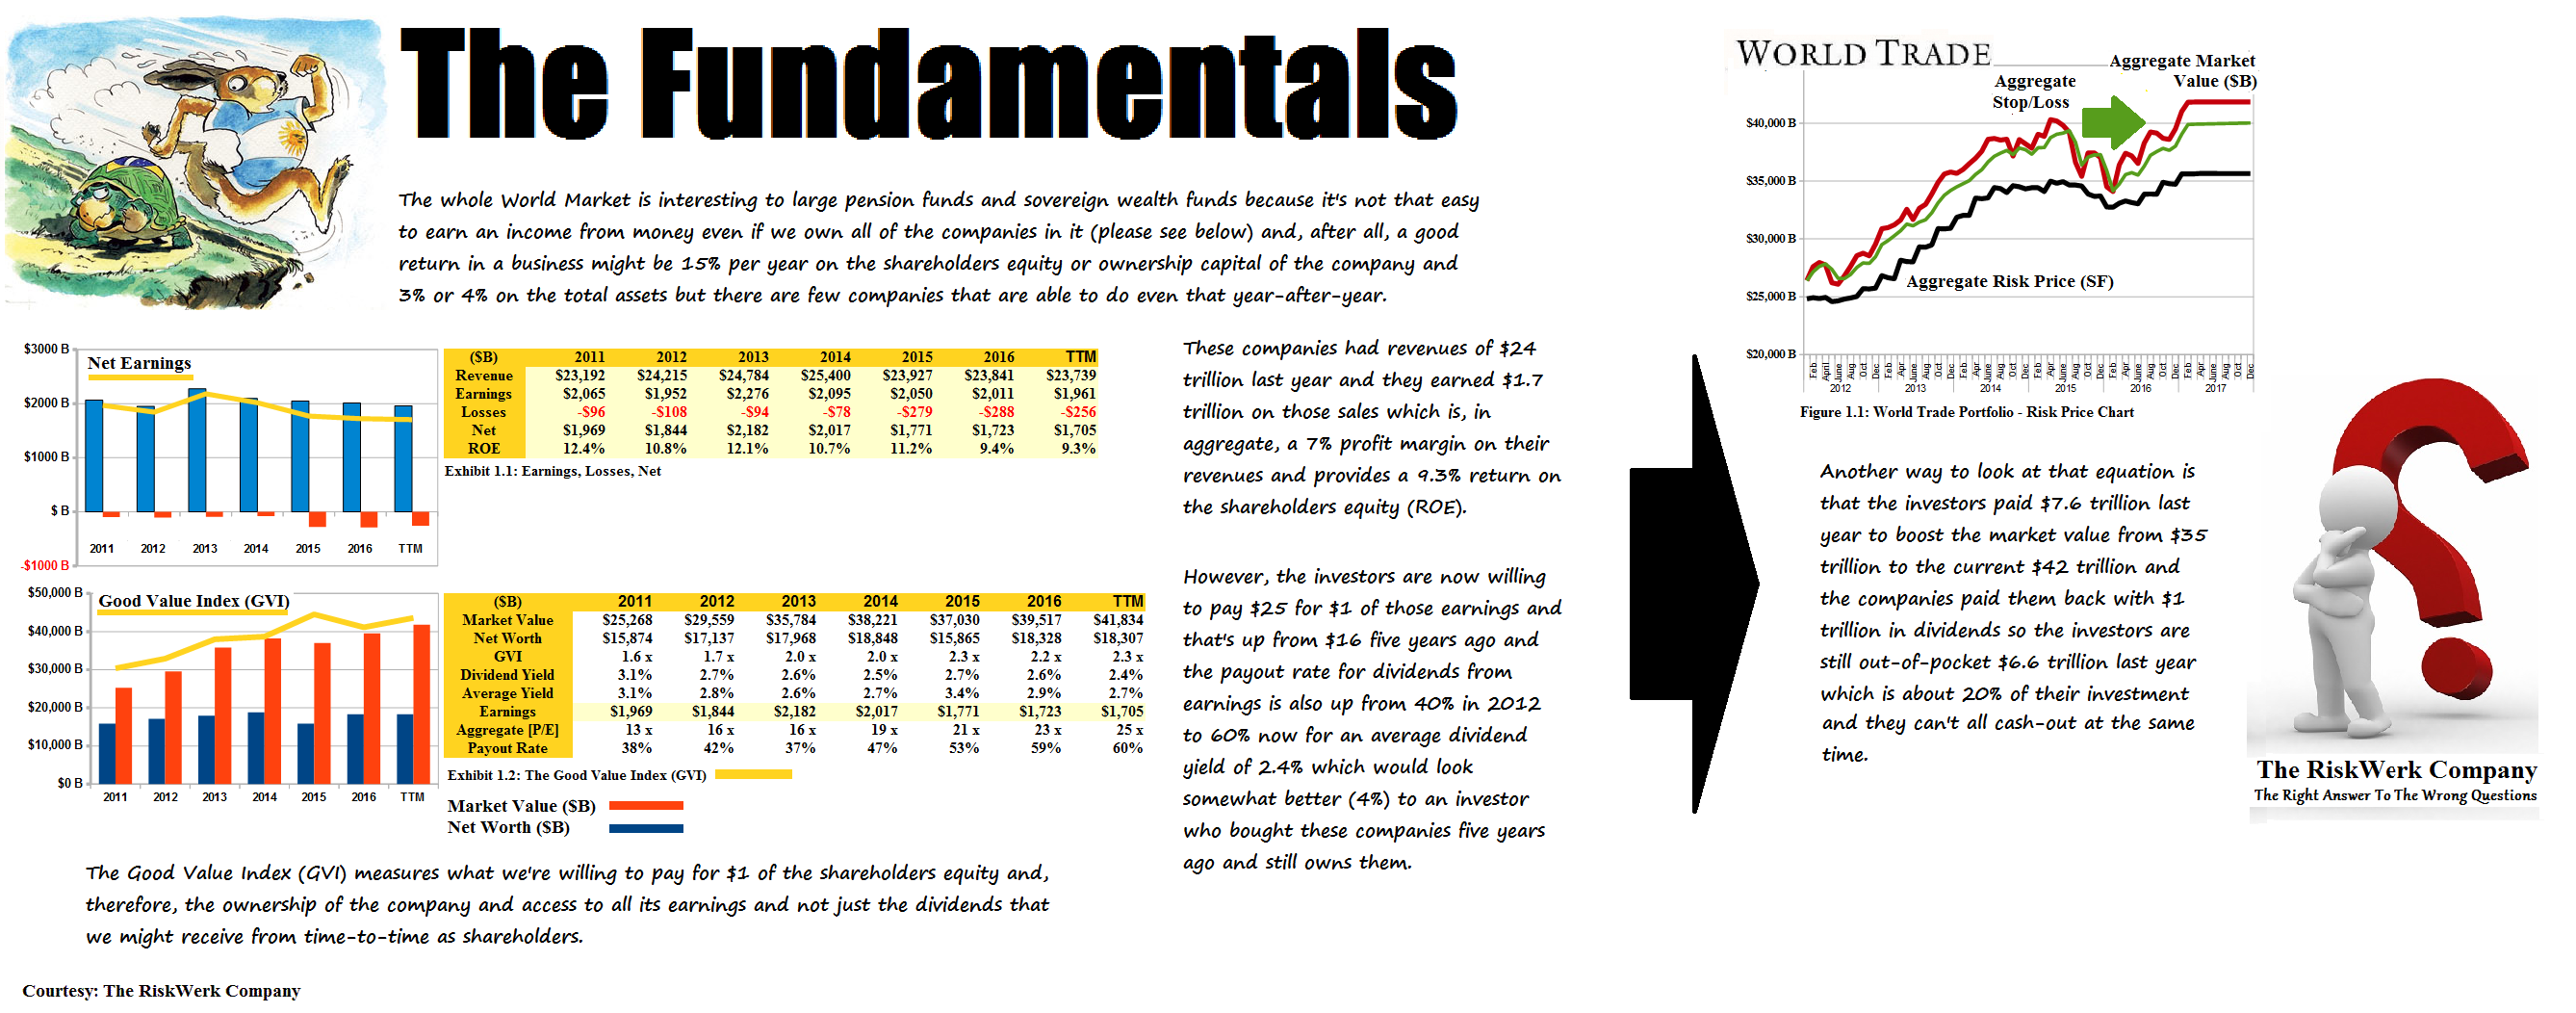
Figure 2: The Price of Everything
The equation that we use in separating the (B)-class portfolio is very similar to the Power Law and it is Risk Price (SF) = [V/N*] × N* per share where N* is determined by the Theory of the Firm and it is a von Neumann-Morgenstern measure of “risk aversion” – the higher its value per unit of market value, the higher is the investor’s need for liquidity and, hence, risk aversion or the inverse of a higher tolerance for risk – and although investors generally try to predict or anticipate future stock prices, we’re only interested in whether today’s stock price is greater than SF and the company is trading in the (B)-class or less than SF and the company is trading in the (N)-class of investor uncertainty and, probably, heightened volatility as millions of investors try to take a position; please see the links above for more information.
The old power law, SP = [P/E] × E, has the result that most investment, particularly the institutional investment, occurs in the range 0 < [P/E] < 50 and the current aggregate is [P/E] = 25x (or as above, [V/E] =25x, with the total market value V and the total net earnings E) and that range, 0 < [P/E] < 50, accounts for about 80% and $40 trillion of the market value of these companies.
But “earnings per share” is also a von Neumann-Morgenstern measure of “risk aversion” (as above) as it’s used in the old power law – the weather report would be more helpful because, surely, if we all carry umbrellas, it will rain; please see Figure 3 below (and click on it and again to make it larger as required).

Figure 3: The [New] Power Law
The preferred rate is actually [P/E] = 20x but it’s been increasing because there is more money to invest than there are earnings and investors have stretched that equation to 25x, 50x, 100x, and more, but generally get nervous at 50x which is a 2% market yield and their expectation is also for capital gains (especially at low [P/E]s, 0 < [P/E] < 20, the “value” investors who hope to buy cheap earnings) because companies, on average, are paying-out only about 60% of their earnings as dividends (although there is a lot of variation) and that’s already up from about 40% four years ago, but it reduces the 4% market yield to only 2.4% and the 2% market yield to only 1.2% and the 1% market yield to the return on a treasury bill.

I only said that we already know that they don’t have any, Mom.
However, we’re not into “simplicity” or “risk” and we want to invest in all of the markets all of the time and especially in the markets that nobody wants with [P/E] < 0 (negative) and [P/E] > 50 and even stratospheric, which looks like our expectations are for losses in the first case and for less than 2% yields in the second.
But that’s an $8 trillion market today with almost five hundred companies in it and a lot of volatility and investor uncertainty and we don’t have to wait for the companies to bring in their earnings – we already know that they don’t have any and that’s a habit that’s hard to break; please see below.
The [New] Power Law
The circumstances of the three markets on the left, center, and on the right, are accurately described by the Theory of the Firm which links those facts with what the investors are able and willing to pay for them according to the “societal standards of bargaining practice and risk aversion”.
For example, the market on the left with [P/E] < 0 is in an “economic depression” with a Free Market Yield of (-0.661% or minus 66 basis points); another way to read that is that the “price of an income” is high, so high that it might not be bought at any price reflecting the facts that there isn’t any or such as there is commands a high price for the ownership of all of the income and about thirty of the companies in that list of more than three hundred companies have been bought-up in the last five years or are in the process of merging or emerging from bankruptcy protection.
Similarly, the market on the right with [P/E] > 50 is a “deflationary market” with a Free Market Yield of 0.294% (29 basis points) and it could be likened to an “economic recession” and it will be an economic recession if the earnings don’t come-in or tend to negative, and the “price of an income” is high because the investors are willing to pay such a high multiple for it now in the absence of an “inflationary” or growth economy.
And the market in the middle 0 < [P/E] < 50 has a Free Market Yield of 0.539% (54 basis points) and it’s neither deflationary nor inflationary but to become a growth market and an engine of real economic growth, the companies earnings will need to increase or the prices that we pay for them in “paper money” will need to decrease towards “real money”.
It’s also noteworthy that both of the markets on the left and the right spin-off a lot of cash that’s not required to maintain our positions and, in particular, just when we needed even more money to buy into the “The Panic of 2015” at very low prices – 2013 prices or less and even a lot less – in the middle-class.
Another surprise is that the deep negative market [P/E] < 0 and the high positive market [P/E] > 50 are effectively antipodal – when one is high, the other is low in a broad sense (please see Figure 4.3 below) – and both of these markets systemically provide higher returns in the (B)-Class Portfolio than in the Rational Middle Market 0 < [P/E] < 50 because their dividend yields are similar but their volatility tends to be higher and, of course, there is never any capital risk in the (B)-Class Portfolio no matter what market we’re in.
And so, once again, rational is good but smart is better (Socrates circa 399 BC before he died); please see the illustrations below for more details (and click on them and again to make them larger as required).
Exhibit 4: The Price of Risk
Figure 4.1: Rational Negative [P/E] < 0 |
 Figure 4.2: Very Rational 0 < [P/E] < 50 |
Figure 4.3: Rational Positive [P/E] > 50 |
For more examples of the (B)-class portfolio in difficult markets, please see our recent Posts on”The “W” Syndrome“, Steel, Green Energy, UFOs and the High Flying Techs, and The Coal War which is heating-up again now; and the Canadian Mines have also taken-off – please see our recent Post “(B)(N) Extreme Economics – The (New) Canadian Mines” for a heads-up on that as well as The Great Rotation & Twenty Hot Canadians 2017.
And for more information and examples of the Free Market Yield and the terms that we have used above, please see our Posts “(P&I) The Dismal Equation (Ecclesiastes 9:1)” and “(B)(N) S&P 100 Volatility Risk and The Full Moon” and “(B)(N) NASDAQ 100 Volatility and The Stone Bunnies“ and for an introduction to The Barometer “(B)(N) What’s A Girl To Do” or “(P&I) The Swiss Franc Debacle“.
And for more information on real “risk management” in modern times and additional references to the theory and how to read the charts and tables, please see our Post, The RiskWerk Company Glossary and “(P&I) Dividend Risk and Dividend Yield“, and our recent Posts “(P&I) The Profit Box” and “(P&I) The Process – In The Beginning“; and we’ve also profiled hundreds of companies in these Posts and the Search Box (upper right) might help you to find what you’re looking for, such as “(B)(N) TLM Talisman Energy Incorporated” or “(B)(N) ATHN AthenaHealth Incorporated” or “(B)(N) PETM PetSmart Incorporated“, to name just a few.
And for more applications of these concepts please see our Posts which rely on the Theory of the Firm developed by the author (Goetze 2006) which calibrates The Process to the units of the balance sheet and demonstrates the price of risk as the solution to a Nash Equilibrium between “risk-seeking” and “risk-averse” investors within the demonstrated societal norms of risk aversion and bargaining practice. And for more on The Process, please see our Posts The Food Chain and The Process End-Of-Process.
And for more on what risk averse investing has done for us this year, please see our recent Posts on “(P&I) The Easy (EC) Theory of the Capital Markets” or “(B)(N) The Easy (EC) Theory of the S&P 500“, and the past, The S&P TSX “Hangdog” Market or The Wall Street Put or specialty markets such as The Dow Transports & Utilities or (B)(N) The Woods Are Burning, or for the real class action, La Dolce Vita – Let’s Do Prada! and It’s For You, Dear on the smartphone business.
And for more stocks at high prices, The World’s Most Talked About Stocks or Earnings Don’t Matter – NASDAQ 100. And for more on what’s Working in America, Big Oil, Shopping in America or Banking in America, to name just a few.
Postscript
We are The RiskWerk Company and care not a jot for mutual funds, hedge funds, “alternative investments”, the “risk/reward equation” and every other unprovable artifact of investment lore. We have just one product
The Perpetual Bond™
Alpha-smart with 100% Capital Safety and 100% Liquidity
Guaranteed
With No Fees and No Loads on Capital
For more information on RiskWerk, please follow the Tags or Categories attached to this Letter or simply enter Search for additional references to any term that we have used. Related data may be obtained from us for free in a machine readable format by request to RiskWerk@gmail.com.
Disclaimer
Investing in the bond and stock markets has become a highly regulated and litigious industry but despite that, there remains only one effective rule and that is caveat emptor or “buyer beware”. Nothing that we say should be construed by any person as advice or a recommendation to buy, sell, hold or avoid the common stock or bonds of any public company at any time for any purpose. That is the law and we fully support and respect that law and regulation in every jurisdiction without exception and without qualification to the best of our knowledge and ability. We can only tell you what we do and why we do it or have done it and we know nothing at all about the future or the future of stock prices of any company nor why they are what they are now. The author retains all copyrights to his works in this blog and on this website. The Perpetual Bond®™ is a registered trademark and patented technology of The RiskWerk Company and RiskWerk Limited (“Company”). The Canada Pension Bond®™, The Medina Bond®™, The Barometer®™, the Free Market Yield®™ and Extreme Economics®™ are registered trademarks or trademarks of the Company as are the words and phrases “Alpha-smart”, “100% Capital Safety”, “100% Liquidity”, ”price of risk”, “risk price”, and the symbols “(B)”, “(N)” and N*.
