Earnings Don’t Matter
Essay. Knowing that a company’s earnings are “honest” and “forthright” is enough to know for investment success (and we’ll prove that). It doesn’t matter (that much) whether they’re negative or positive, as much as it matters to know why that might be (and we’ll prove that too). Moreover, thinking that we know more than that – such as future earnings or hidden “value” – is harmful to investment success (and we’ll prove that too).

Maslow’s Golden Hammer Mr. Fix It
We’ve had to take up our own challenge of “earnings don’t matter” because nobody else will, and we’re daily bludgeoned with the news reports of company earnings, which is good as news – it’s nice to know that a company in our portfolio is still breathing – but quickly becomes bad news as analyst after analyst weighs in on their edits, projections and speculations, and investors chase them.
We can dismiss out of hand the many cases of earnings fraud (such as Enron or Bre-X or innumerable Ponzi cases) but are, nonetheless, disturbed by the failure of the richly endowed “earnings industry” to pick these up – and even celebrate them – before they become a public disaster.
Notwithstanding fraud, the driver in this “clammer for the hammer” is the naive notion that an investor should buy stocks that have a “low PE”, that is, the price to earnings ratio (PE) is low for the company, its industry or peers, and suggests that the stock price hasn’t kept up with the earnings and “value” of this company, and, therefore, we should expect – it is said – that the stock price will increase as other investors become aware of it and want to, somehow, stake a claim on a sliver of the future earnings by buying the company’s stock now.
The motivation is the equation,
“Stock Price” (SP) = PE × EPS, where EPS is the earnings per share,
which is exact if we know both the stock price and the earnings, but it’s usually rendered, or thought of, as:
“Stock Price” (SF) = [PE] × [EPS]
where [PE] is “normative” (please see below for high or low PEs) and [EPS] could be the current actual earnings per share, or a forecast, so that the “Stock Price” (SF) is implied or fictional and can be compared with the actual stock price, SP, at any time.
The earnings per share, [EPS], is a measure of “risk aversion” to which investors should respond accordingly if the [EPS] is decreasing (or negative, suggesting that [SF]=0) or increasing, and SF is, therefore, a “risk-adjusted price” of Sharpe-Markowitz type. (For references, please see our Post on The Price of Risk.)
Moreover, the difference between the stock price, SP, and the forecast or calculated “Stock Price” (SF), U = SP – SF, is a “utility” of von Neumann-Morgenstern type.
We can say that a current stock price has “positive utility” for the investor if it exceeds the “Stock Price” (SF) meaning that the stock that is currently priced as SP, creates an economic “free good”, U = SP – SF >0, which shouldn’t exist in an efficient market, and we should expect that either SF will increase, or is wrong, or that the stock price, SP, should decrease as investors realize that they are paying too much for buying or holding this stock at the price, SP, and take profits (the positive part).
Similarly, if we have confidence in SF, and the utility is negative, then we should expect the stock price to increase, which is the basis for buying low, and selling high. That the utility is negative for the investor simply means that the investor should buy the stock and assume the risk that SF is wrong, although “value investors” generally assume SF is right but SP is wrong and should, accordingly, increase.
When stated this way – in terms of investment risk and risk aversion – the equation for risk, U = SP – SF, has a fine pedigree and has been worked on for more than seventy years.
Moreover, the equation for utility is exactly the same as the equation that underwrites the Capital Assets Pricing Model (CAPM), which substitutes “returns” for “prices”, and also doesn’t work and produces “solutions” that are not only mathematically unstable, but intrinsically unstable because the stock price (or return) is what it is, and not what it should be unless we are willing to substitute the information that is in the stock price for something else that it should be, but isn’t.

Axe Trumps Hammer
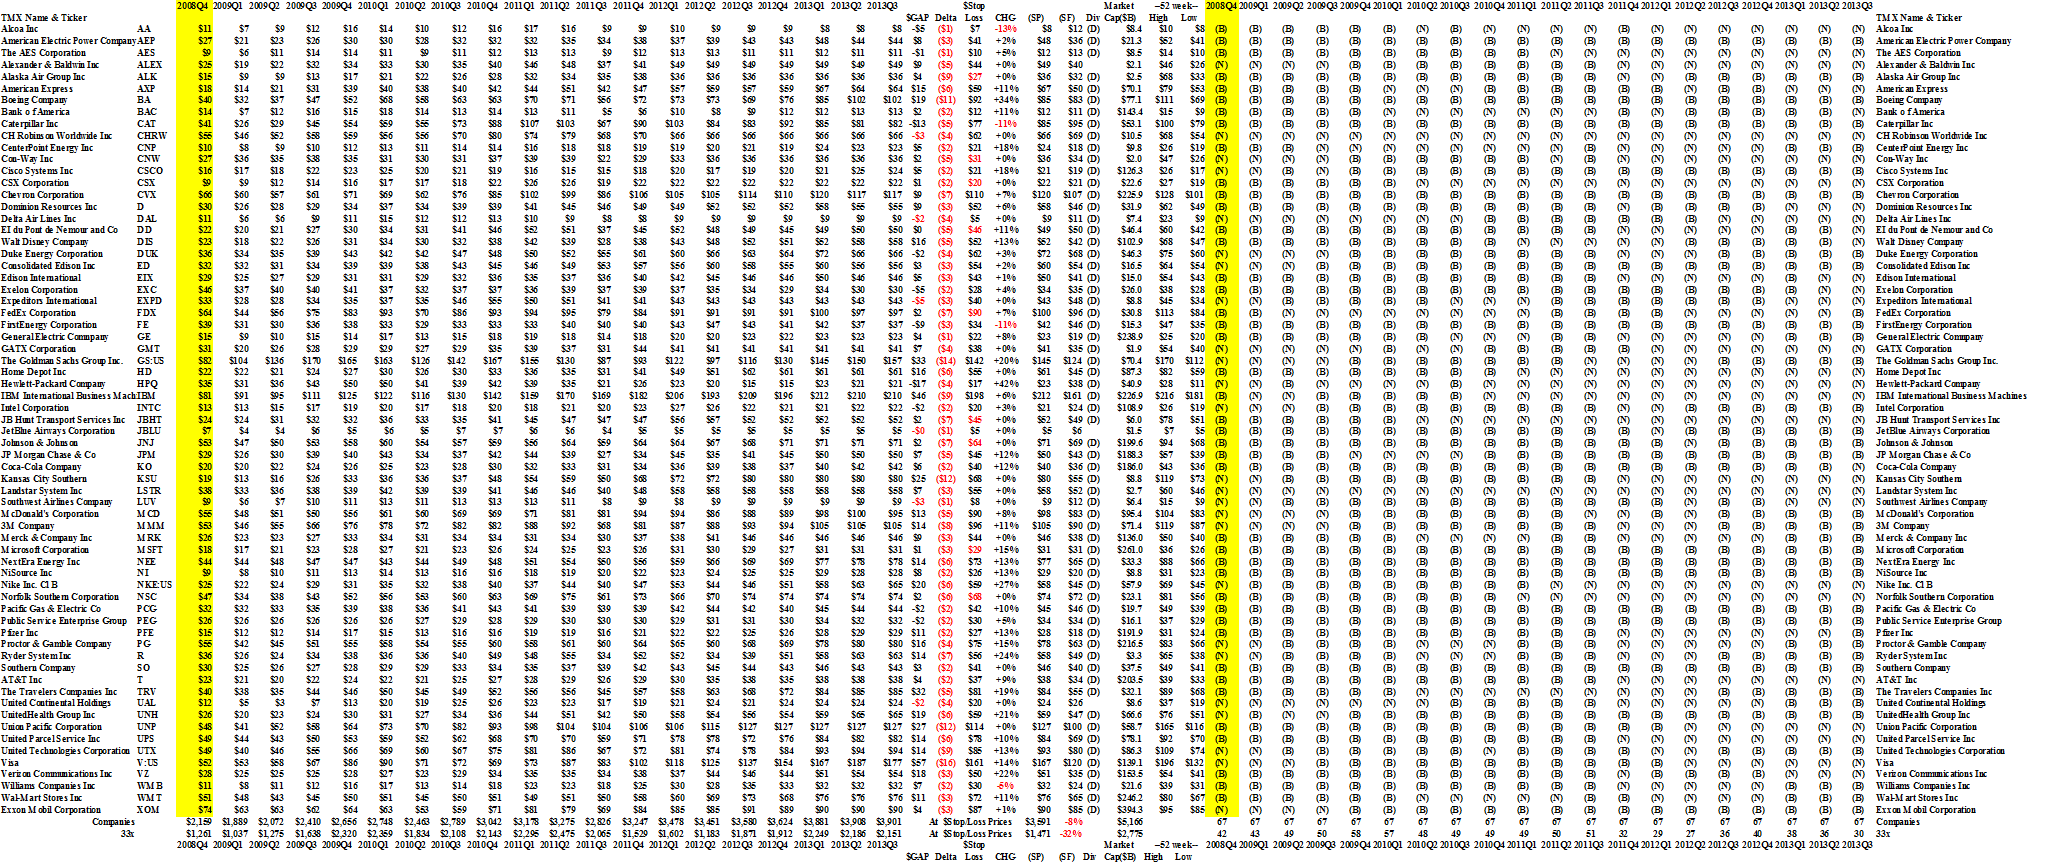
In order to cut some wood, and wade through this forest of ifs and shoulds, we ran the paradigm against the Dow Jones NYSE companies, including the industrials, transports and utilities (67 companies over the most recent five years, with a combined market value of $5.2 trillion) and the NASDAQ 100 companies (with 125 companies and a market value of $2.8 trillion) on a portfolio basis.
That is, we always bought any and all companies that were trading with a low PE and sold them when the PE was high.
“Low” and “high” are easily determined because the reciprocal (1/PE) of the PE has the interesting interpretation of a yield, similar to bond yield, so that we can say that a PE is low if the “bond yield” (1/PE) is high, and a PE is high if the bond yield is low, which is reason enough for investors to buy and sell these stocks because they want both yield and capital safety.
For example, PEs below 33×, 20×, and 12×, are equivalent to bond yields of greater than 3%, 5% and 8%, respectively, and, therefore, it makes sense for investors to buy low PEs because they exceed the readily available bond yields, and to sell high PEs because they can get better, or as good as, returns in bonds with less apparent risk because bonds are generally secured assets and more certain to pay back the investment.
With reference to Exhibit 1 below, between December 2008 and now, the Dow Index (which is price weighted) is up +74% (Index line), and simply buying the same number of shares in each company and holding them until now, without change, returned +81% (Companies line).
But the “buy low, sell high strategy” with PE<33 and an expected yield in excess of +3% per year, returned +43% (Total line), or an average return of about +8% per year.
Which sounds OK, even if sub par to the “do nothing” buy and hold portfolio, but that’s not what the investors saw who are chasing yield every quarter and basically starting a “fresh quarter” every quarter as they re-balance their portfolio and flip between bonds and equities.
What the investors saw is a portfolio that quarter-over-quarter varied between +10% and -11%, and if they followed the practice of “buy low, sell high” on a quarterly basis, their cumulative return over five years is +2% every three months; and when four quarters are consecutively managed that way, and we respect the annual “oil change” for year-end tax selling and the “January effect”, for example, their cumulative return over five years drops to +1% over every three months.
These results are demonstrated in Exhibit 2 and 3 below in which all the returns are indexed to base 100.
Exhibit 1: Dow NYSE Portfolio (33× Expected Yield > 3%) – Cash Flow
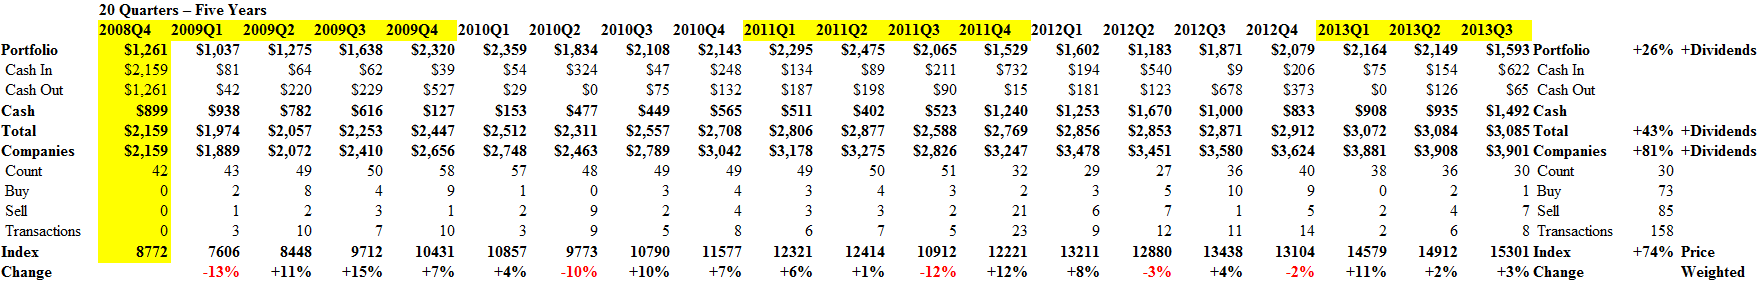
(Please Click on the Chart to make it larger and again if required.)
Exhibit 2: Dow NYSE Portfolio (33× Expected Yield > 3%) – What the investors saw

Dow NYSE PE 33x
The All Companies (Q and A) is the buy and hold all companies portfolio, no trading.
The Total (Q and A) is the actively managed portfolio that responds to new PE < 33× (buy) or PE > 33× (sell) as quarterly information becomes available.
(Please Click on the Chart to make it larger if required.)
The difference between (Q) and (A) is that (Q) is exactly quarter-over-quarter, and reflects the experience of “new money”, whereas each (A) point, or value, is the result of the four previous quarters of Q-type management and, so, represents the experience of investors who have been in the market for at least a year.
But wait, the agony isn’t over yet. Most of the thirty companies that are currently in the portfolio and selected by the PE<33× rule, have provided meagre returns this year (Nike is best at +27%, First Energy returned (-11%), and the average is +8%) and the downside based on the demonstrated volatility is minus (-32%) in contradistinction to all the companies which is minus (-8%).
Moreover, things don’t get any better when we look for higher yields such as +5% per year (PE < 20×) or +8% (PE < 12×) because the portfolios get smaller, and although the variability of the returns is less, between +8% and -7%, the absolute returns get smaller (down to +30% and +10%, respectively, for five years) and the quarter-over-quarter or annual “managed returns” are close to zero and even negative.
Exhibit 3: Dow NYSE Portfolio (12× Expected Yield > 8%) – What the investors saw

Dow NYSE PE 12x
The bottom line is that what should happen, doesn’t happen.
And when one ups the ante to find “really good value” with PEs <12 and a prospective yield of better than 8%, it gets worse:
(Please Click on the Chart to make it larger if required.)

QED
For more on what risk averse investing has done for us this year, please see our recent Posts on The S&P TSX “Hangdog” Market or The Wall Street Put or specialty markets such as The Dow Transports & Utilities or for the real class action, La Dolce Vita – Let’s Do Prada! and It’s For You, Dear on the smartphone business.
Postscript
We are The RiskWerk Company and care not a jot for mutual funds, hedge funds, “alternative investments”, the “risk/reward equation” and every other unprovable artifact of investment lore. We have just one product
The Perpetual Bond™“
Alpha-smart with 100% Capital Safety and 100% Liquidity”
Guaranteed
With No Fees and No Loads on Capital
For more information on RiskWerk, please follow the Tags or Categories attached to this Letter or simply enter Search for additional references to any term that we have used. Related data may be obtained from us for free in a machine readable format by request to RiskWerk@gmail.com.
Disclaimer
Investing in the bond and stock markets has become a highly regulated and litigious industry but despite that, there remains only one effective rule and that is caveat emptor or “buyer beware”. Nothing that we say should be construed by any person as advice or a recommendation to buy, sell, hold or avoid the common stock or bonds of any public company at any time for any purpose. That is the law and we fully support and respect that law and regulation in every jurisdiction without exception and without qualification to the best of our knowledge and ability. We can only tell you what we do and why we do it or have done it and we know nothing at all about the future or the future of stock prices of any company nor why they are what they are, now. The author retains all copyrights to his works in this blog and on this website. The Perpetual Bond®™ is a registered trademark and patented technology of The RiskWerk Company and RiskWerk Limited (“Company”) . The Canada Pension Bond®™ and The Medina Bond®™ are registered trademarks or trademarks of the Company as are the words and phrases “Alpha-smart”, “100% Capital Safety”, “100% Liquidity”, ”price of risk”, “risk price”, and the symbols “(B)”, “(N)” and N*.
