Earnings Don’t Matter
Essay. This is the “earnings season” as company after company stands up to be counted by analyst, pundit, and investor alike (please see some of our recent (B)(N)-Company Posts). It’s unnerving to us because we know that “earnings” have nothing to do proactively with investment success – we’d like to keep our money – 100% Capital Safety – and obtain a hopeful but not necessarily guaranteed return above the rate of inflation, which, of course, is just another way of losing our money if we don’t get it. So, we’re crying all the way to bank because it’s misinformation of that sort – that earnings really matter – that helps us to make money in the stock market. For example, please see any of the portfolios in our recent Posts, S&P TSX Winners & Losers, April 2013, The Dow Transports, March 2013, or The Wall Street Put, March 2013, or The Risk Adjusted Dow, March 2013, or The Canada Pension Bond, February 2013, and, particularly, The Dow Transports, March 2013, a portfolio in which we dabble in six to twelve of the unlikely transports that has produced a staggering return of +28% so far this year (three months) and, using our usual methods of “price protection”, our return will not be less than that for the rest of year, and we know exactly how that is done, and can continue to do it year after year after year (boring isn’t it) as long as there is an equities market anywhere, whether or not it thrives on misinformation and “bad” thinking.
We don’t expect to get any new acolytes to our methods; that’s the nature of free will, and so it is that we must keep going to the bank with what was their money, and is now ours. But for those of you who have a scientific or mathematical inclination, and want to stop slaving over “earnings” night and day, it’s fairly easy to prove what we’re saying – that earnings don’t matter because they don’t have much to do with investment success. In fact, the same method, which we’ll describe below, can be used to show, demonstrate, or prove in mathematics and the common paradigms of economics, depending on our level of rigour, three plus one (four) things, three of which are negative and one of which is positive:
1. Earnings don’t matter;
2. Buy Low and Sell High doesn’t work;
3. The Capital Assets Pricing Model (CAPM) doesn’t work; and
4. The Risk Price (SF) does work; that is, our portfolio which is a diversified portfolio across an equities market that is working and which is selected and maintained using just the “One Rule”, is a portfolio that is 100% capital safe and provides a hopeful return above the rate of inflation that might be given up by the equities market (which, we assume, is working, based on the evidence).
To show this, we note that the stock price that’s predicted or tied to earnings can be written as:
“Risk Adjusted Price” = SF = [PE] × EPS
where the [PE] is the “price to earnings multiple” that is normative in some sense, such as deemed typical of the industry or that class of company; typical PEs might be 10 or 20, and are carefully studied and tabulated for industries and companies. The EPS is the “earnings per share” taken on an annual basis, so that quarterly earnings per share are often extrapolated into annual earnings per share, using all the information that becomes available from the preceding quarterly and annual reports, and pondering the future. “Time” is not important, however, because as far as the “test” is concerned, it’s equivalent to a change in the currency unit, such as, for example, from dollars to yuan, and the method is independent of such “scale” as long as all the prices are in the same units.
However, SF so-defined is also a “risk adjusted price” of Sharpe-Markowitz type (of the Capital Assets Pricing Model) and the difference between an actual stock price, SP, and SF:
U = SP – SF
is a utility function of von Neumann-Morgenstern type (please see our Post, The Price of Risk, August 2012, for additional references). We can say, then, that a current stock price, SP, has “positive utility” if it exceeds the “risk adjusted price”, SF, and “negative utility” otherwise. It’s all that because investors take the EPS as a measure of “risk aversion” – the more EPS, the better, they say, and an increase or decrease in EPS is (obviously) significant to them. But is it significant to their investment success? Does it mean that their capital is safe and that they might receive a hopeful return above the rate of inflation?
To test that hypothesis, track the performance of portfolios of stocks that demonstrate positive utility – call them (B) – and portfolios of stocks that demonstrate negative utility – call them (N). To avoid “cheating”, a company must be either a (B) or an (N) at any time (but not necessarily the same (B) or (N) at all times) and all companies in a “market” or domain such as the Dow Jones Industrial Companies must be so assigned. Moreover, a company that is deemed to make an (N)- to (B)-transition, must be bought at that price (the (B) price which succeeds the (N) price), and a company that makes a (B)- to (N)-transition must be sold at the (B) price (because of price protection, either a stop/loss or protective put), and to avoid unnecessary and specious turnover in the portfolio, apply some rule such as “once deemed a (B) it must stay a (B) for the next three months or the next week or so” and the same for the (N)-companies (which is reasonable because new earnings reports are not available more frequently and, therefore, the SF price is expected to be constant for some period of time).
Illustrating the results is tricky because there are usually thousands of data points in the sample, but we can summarize the results in three ways; the standard cash flow report; or the portfolio summary; and a third way, more statistical, that we illustrate below in the case of the S&P 500 NYSE over a ten year period. For example, the Cash Flow Summary and Portfolio Summary for the Dow Transports is summarized below (Exhibit 1 and 2) but we are using the method (4) based on the Risk Price (SF) which “works”:
Exhibit 1: The Perpetual Bond™ in the Dow Transports – Cash Flow Summary
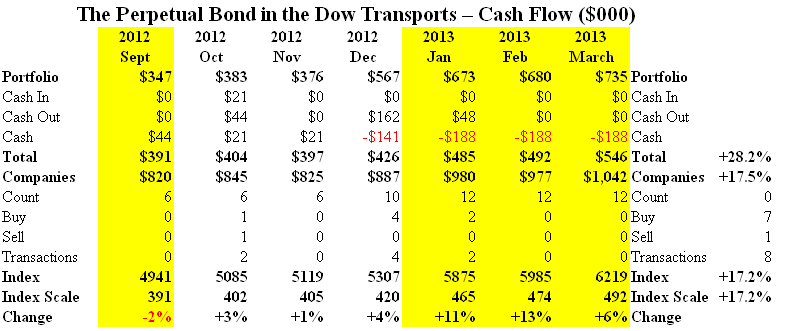
(Please Click on the Chart to make it larger if required.)
Exhibit 2: The Perpetual Bond™ in the Dow Transports – Portfolio Summary

(Please Click on the Chart to make it larger, and again, if required.)
Using the same setup, we can also test another hypothesis that doesn’t work – (2) “buying low and selling high” doesn’t work. To test that, we only buy and hold stocks that are in (N) and we sell them at the (B) (or “high”) price on an (N)- to (B)-transition, and buy them at the (N) (or “low”) price on a (B)- to (N)-transition; and we further note that “low” can be induced by “low PEs” regardless of the EPS. There are several examples of such portfolios in these Posts and we usually call them the “Contra Portfolio”, emphasizing the “Occam’s Razor” nature of the test; please see, for example, our Post, NASDAQ 100 – (B)(N) There And Done That, June 2012.
Finally, using the same setup (and this will break some hearts), we can show that (3) the Capital Assets Pricing Model (CAPM) doesn’t work. To do that, replace SP and SF by the investment returns so that SF is the expected or demanded return for the stock in some period, and is the measure of “risk aversion”, such as more or positive returns are better, and SP is the actual return in the same period, and again, for every stock in the domain. Whereas methods (1) and (2) are widely used by “active investors” (please see our Post, The Active Investor (DOA), November 2012), method (3) is the mainstay of nearly all mutual funds and hedge funds, which are, basically, “wholesale-ing” investor money without much thought or method, and was the downfall of Long Term Capital Management LP (1998), nearly taking down the world equity markets with it.
And for what does work …
To see what does work, we’ve drawn on data that is more fully explained in our Post, Stock Prices Are The New Pink, June 2012. The sample space (or “basket”) consists of the quarterly stock prices (17,500 of them) drawn on the S&P 500 companies over a ten year period (2000-2009) and each price is tagged by a company name and the year-quarter in which that price obtained, SP=SP(Company, Year-Quarter); otherwise, there is nothing special about these prices – they are not systematically minimums, maximums, medians or averages, for example – and all that we know is that the stock was bought and sold at that price during that year-quarter regardless of whatever other price the stock had or subsequently obtained. We can obviously randomize the sample as much as we like; we have often said in these Posts that “purchase prices” don’t matter – all that matters is the Risk Price (SF) which is not random but a calculation based on the generally known balance sheets of the companies. Please see our Posts, The Price of Risk, August 2012 and The Nash Equilibrium & Its Stock Price, October 2012, for more details.
If SP=SP(company, quarter) is a stock price in the basket and SP1 is the stock price drawn from the previous quarter for the same company, then the coloured threads (please see Exhibit 3 and 4 below) show the path of such collections of log(SP/SP1) as long as SP1 was a (B) or (N) – that is, either SP1 exceeded the price of risk (SF1) at that time and was therefore a (B), or was below the price of risk (SF1) at that time and was therefore an (N) that became a (B) or remained an (N) during the quarter or in the next quarter.
In order to squeeze all of this information into a small and colourful space, we scaled the x-axis uniformly as -½ log(b) to the base (a) = -½ log(b)/log(a) where (b) is the product of all the positive returns (SP/SP1, SP>SP1) in any quarter (and is therefore greater than one), and the base (a) is the product of all the negative returns (SP/SP1, SP<SP1) in any quarter (and is therefore less than one).
Exhibit 3: Bond-like Behaviour Above the Price of Risk – SP>SF

Log(SP/SP1) if SP>SF.
The instances of price increase, quarter over quarter (SP/SP1), over price decrease (SP/SP1), were better than 2:1 in this example, based on all of the companies of the S&P 500, and the center of mass is greater then zero, that is, it is positive and up and to the right, in the first quadrant, and it is obvious that the quarterly changes are significantly different in size, direction, and volatility from the ones in the chart below, in the same family of stocks. Note that the y-axis is substantially in the range [-0.5, 1.0] as opposed to [-1.0, 0.5] in the chart below and that the x-axis range is not as fiercely truncated.
Exhibit 4: Equity-like Behaviour Below the Price of Risk – SP<SF
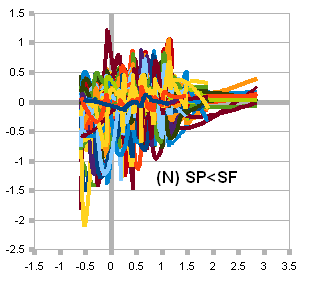
Log(SP/SP1) if SP<SF.
The instances of price increase (SP/SP1), quarter over quarter, over price decrease (SP/SP1), were about even, and the center of mass is less than zero, that is, negative, down and to the left, with a markedly increased volatility (as measured by distance on the x-axis and size on the y-axis), and with a higher reward (or loss) potential, if we’re right (or wrong), and willing to place our bets against the risk seekers, volatility players, and market makers, banks, and brokers who also rely on micro-arbitrage profits in agency and transaction costs in making their decisions.
The actual numbers are as follows:
(B)(N) Price Increase Price Decrease Ratio
(B) SP>SF 4,728 2,290 2.06
(N) SP<SF 5,515 5,025 1.10
And that’s all that one really needs to know – that the house odds on the portfolio (B) SP>SF, which is we (who want to keep our houses), are 2 to 1, and in the “volatility range” of “investor uncertainty”, (N) SP<SF, are 1 to 1.
Postscript
We are The RiskWerk Company and care not a jot for mutual funds, hedge funds, “alternative investments”, the “risk/reward equation” and every other unprovable artifact of investment lore. We have just one product
The Perpetual Bond™
“Alpha-smart with 100% Capital Safety and 100% Liquidity”
Guaranteed
With No Fees and No Loads on Capital
For more information on RiskWerk, please follow the Tags or Categories attached to this Letter or simply enter Search for additional references to any term that we have used. Related data may be obtained from us for free in a machine readable format by request to RiskWerk@gmail.com.
Disclaimer
Investing in the bond and stock markets has become a highly regulated and litigious industry but despite that, there remains only one effective rule and that is caveat emptor or “buyer beware”. Nothing that we say should be construed by any person as advice or a recommendation to buy, sell, hold or avoid the common stock or bonds of any public company at any time for any purpose. That is the law and we fully support and respect that law and regulation in every jurisdiction without exception and without qualification to the best of our knowledge and ability. We can only tell you what we do and why we do it or have done it and we know nothing at all about the future or the future of stock prices of any company nor why they are what they are, now. The author retains all copyrights to his works in this blog and on this website. The Perpetual Bond®™ is a registered trademark and patented technology of The RiskWerk Company and RiskWerk Limited (“Company”) . The Canada Pension Bond®™ and The Medina Bond®™ are registered trademarks or trademarks of the Company as are the words and phrases “Alpha-smart”, “100% Capital Safety”, “100% Liquidity”, ”price of risk”, “risk price”, and the symbols “(B)”, “(N)” and N*.
