Earnings Don’t Matter – NASDAQ 100
Essay. In our earlier Post, we showed that “earnings don’t matter” on a portfolio basis, where the portfolio domain is the sixty-seven companies of the current Dow NYSE market of the industrials, transports and utilities. One of the conclusions is that we can expect to do well just by owning all of the companies, collecting our dividends, and never bothering with the portfolio except to buy more (or selling some if we need some cash).
Exhibit 1: Dow Industrials Portfolio (PE < 33× Expected Yield > 3%) – What the investors saw

Dow Industrials PE 33x
However, we don’t have to own the stocks of all sixty-seven companies; just owning all the stocks of the thirty companies of the Dow Industrials, purchased as an equal number of shares in each, at the market prices, produced a portfolio gain of +100% since early 2009, averaging +4% per quarter (geometric average) plus dividends which will add another +2% to +3% per year to the returns.
Please see Exhibit 1 (Brown lines). Click on the Chart to make it larger if required, and please see our earlier Post for more details on the Q’s and A’s.
But this is not an argument for owning the Index or an ETF, for example, because when we own the stocks we have more flexibility, that is liquidity, in deciding what to sell at higher prices and what to buy at lower prices, and less exposure to market volatility because not all of the stocks have the same exposure all of the time.
And the “strategy” scales from tens of thousands to tens of billions without a problem. And if we decide to sell something, it’s on the basis of taking some profits rather than a PE-ratio.
In contrast, the actively managed “buy low, sell high” portfolio consistently managed with PEs<33 (a temperate +3% yield) produced only +50% (Blue lines) in five years and currently has only ten companies in it and the indicated stop/loss prices could result in a loss of minus (-28%) if the market suddenly swoons again.

Sawing It Off With Buy Low Sell High
Courtesy: Jean-Francois Millet, Artist
On the plus side, however, it did produce an average quarterly yield of +2.2% (geometric mean) which amounts to about +9% per year, but we also had to make 32 buy decisions and 42 sell decisions in the previous five years, based only on PE<33 (buy) and PE>33 (sell), and that the demonstrated yield is so much more than the predicated +3% per year, suggests that the method is irrelevant to the actual returns.
Moreover, the “predicated portfolio” PE<12 (yield>8% per year) that was supposed to produce those results gave us only +0.5% per quarter and +2% per year over five years.
Should we then be surprised that the Contra Policy of “buying high and selling low”, so to speak, did the best of all?
Exhibit 2: Dow Industrials Contra Policy (PE >12×, Predicated Yield < 8%)
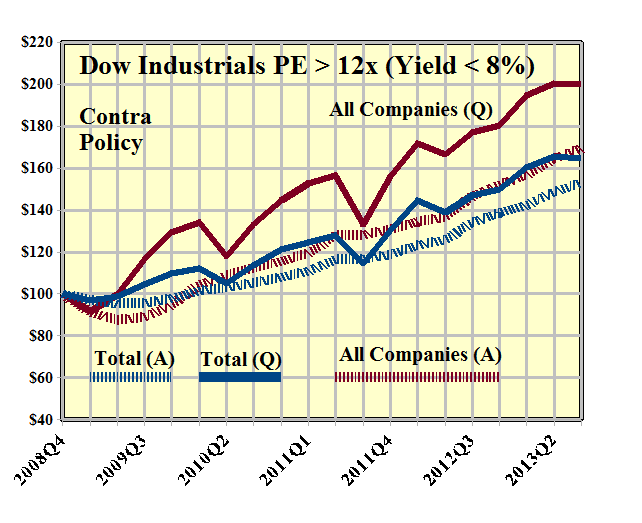
Dow Industrials PE 12x Contra
This portfolio in the thirty companies of the Dow Industrials uses the rule PE>12 (buy) and PE<12 (sell) which is the exact opposite of “buying low and selling high” and it smoothly returned +65% in five years.
Note especially the smooth, near volatility-free, Total (A) portfolio.
Moreover, the quarterly yield is an average +2.7% and the annual yield is +11% for five years, defying the “predicated yield” of less than 8% per year.
(Please Click on the Chart to make it larger if required.)
All of these results in the Dow pale beside those of the NASDAQ 100 companies which tend to be in the triple digits over five years, unless we were “buying low and selling high”.
The results are summarized in the following charts and the details by clicking here.
Exhibit 3: NASDAQ 100 Portfolio (33× Expected Yield > 3%) – What the investors saw

Nasdaq 100 PE 33x
Our NASDAQ 100 currently has 127 companies in it because we follow some of the foreign equities listed in New York as ADRs, and also some companies that are new to the Nasdaq and have reasonably large capitalizations.
With reference to Exhibit 3 and the Cash Flow Chart in Exhibit 4, below, the passive buy/hold portfolio of 1,000 shares in each company, regardless of price differences, cost $2,709,000 in December 2008 and early 2009, and is currently worth $9,585,000 for a gain of +254% (plus dividends) in five years (Companies line in Exhibit 4).
Exhibit 4: NASDAQ 100 Portfolio (33× Expected Yield > 3%) – Cash Flow

NASDAQ 100 x33 Cash Flow
(Please Click on the Chart to make it larger if required.)
The actively managed portfolio of “buy low, sell high” with PEs<33 and an anticipated yield of more than 3% per year, bought 110 of those companies for $2,388,000 (leaving a cash balance of $321,000 at that time) and currently holds 75 companies with a current value of $6,590,000 (and cash $61,000) and the portfolio returned +145% in the same five years (Total line, which includes Cash or settles the Margin Account (negative cash)).
“Active management” as companies fell in and out of the PE-grace, required that we also executed 281 buy transactions and 316 sell transactions for a total of 597 transactions in five years among the 127 companies of the market.
Exhibit 5: NASDAQ 100 Portfolio (20× Expected Yield > 5%) – What the investors saw

Nasdaq 100 PE 20x
If we increased the yield requirements to PE<20 (yield>5%), the performance dropped off to +110% in five years (Exhibit 5).
And for PE<12 (yield>8%), to +65% (Exhibit 6 below) even though the portfolio had more than fifty companies in it most of the time (currently 47 companies) and we executed 248 buy transactions and 308 sell transactions for a total of 556 transactions respecting the rule.
(Please Click on the Charts to make them larger if required.)
Exhibit 6: NASDAQ 100 Portfolio (12× Expected Yield > 8%) – What the investors saw
Nasdaq 100 PE 12x
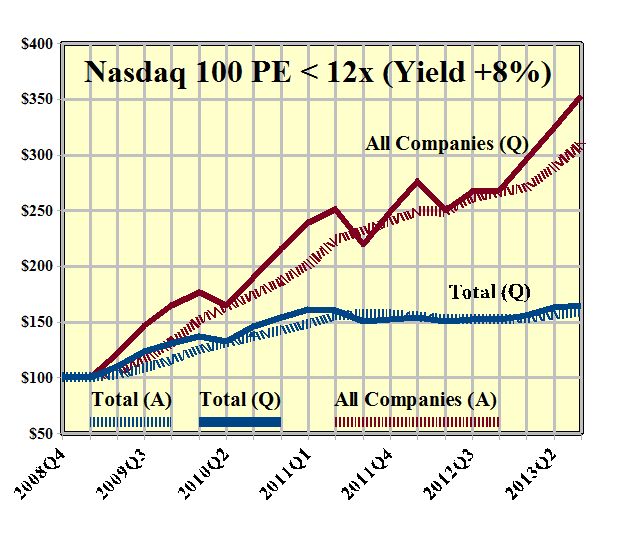
And, once again, the Contra Policy (please see Exhibit 7 below) is the most attractive.
In this, we are, basically, buying “high priced” earnings with PEs>12 and a predicated yield of less than 8%, and selling them when the earnings become “cheap” and the PE<12.
The portfolio produced a gain of +140% in five years and the average quarterly gains were +4.7% and +20% per year, every year, on average.
Exhibit 7: NASDAQ 100 Contra Policy (PE >12×, Predicated Yield < 8%)

Nasdaq 100 PE 12x Contra
The moral of this story seems to be that if we’re going to buy only “cheap stocks” with low PEs, then we should plan, instead, to buy them all, regardless of the PE, because a PE can be low for reasons that do not support the expectation that the “price of the earnings” (the PE) should increase.
We think that observation applies to both “secular companies” – companies that make and sell things that we use all the time – as well as “cyclical companies” whose earnings wax and wane on a regular and predictable schedule depending, for example, on the demand and supply of commodities.
It hardly seems worthwhile to try to separate the chaff from the grain, so to speak, when buying them all is so straightforward and productive regardless of how much money we have.
On the other hand, if we buy only the “expensive stocks” with PEs>12 and a predicated current yield of less than 8% per year, and sell them when they become “cheap”, it supports what we want: good companies at good prices and we are willing to pay them.
And the demonstration is that the prices are likely to get better as long as the earnings keep up and justify our confidence. If the earnings don’t keep up, and the PE increases even more, then we should just check our stop/loss, or use some of our profits to buy puts that will protect the price of the rest. A “new” earnings report is going to be “old news” in any case.

Axe Chops Hammer & Saw
We also note that the PE is the “price of earnings per share” (EPS) and if the EPS is the only measure of “risk aversion” that we have, then the PE is the “price of risk” per unit of risk.
For more on what risk averse investing – and the real “price of risk” – has done for us this year, please see our recent Posts on The S&P TSX “Hangdog” Market or The Wall Street Put or specialty markets such as The Dow Transports & Utilities or for the real class action, La Dolce Vita – Let’s Do Prada! and It’s For You, Dear on the smartphone business.
Postscript
We are The RiskWerk Company and care not a jot for mutual funds, hedge funds, “alternative investments”, the “risk/reward equation” and every other unprovable artifact of investment lore. We have just one product
The Perpetual Bond™“
Alpha-smart with 100% Capital Safety and 100% Liquidity”
Guaranteed
With No Fees and No Loads on Capital
For more information on RiskWerk, please follow the Tags or Categories attached to this Letter or simply enter Search for additional references to any term that we have used. Related data may be obtained from us for free in a machine readable format by request to RiskWerk@gmail.com.
Disclaimer
Investing in the bond and stock markets has become a highly regulated and litigious industry but despite that, there remains only one effective rule and that is caveat emptor or “buyer beware”. Nothing that we say should be construed by any person as advice or a recommendation to buy, sell, hold or avoid the common stock or bonds of any public company at any time for any purpose. That is the law and we fully support and respect that law and regulation in every jurisdiction without exception and without qualification to the best of our knowledge and ability. We can only tell you what we do and why we do it or have done it and we know nothing at all about the future or the future of stock prices of any company nor why they are what they are, now. The author retains all copyrights to his works in this blog and on this website. The Perpetual Bond®™ is a registered trademark and patented technology of The RiskWerk Company and RiskWerk Limited (“Company”) . The Canada Pension Bond®™ and The Medina Bond®™ are registered trademarks or trademarks of the Company as are the words and phrases “Alpha-smart”, “100% Capital Safety”, “100% Liquidity”, ”price of risk”, “risk price”, and the symbols “(B)”, “(N)” and N*.
