The Wall Street Put
Drama. The new earnings reports are coming to Wall Street next week (the week of April 22) and all the markets are down as investors prepare for the “1st Quarter Fest” – the Dow fell 2.1%, the S&P 500 lost 2.1%, the Nasdaq slid 2.7%, and the S&P/TSX Composite Index (only an observer this year but sympathetic) is also down 2.2% and minus 4% for the year – so we figure that there’s about $400 billion in new cash and mad money that is parked and waiting (with three days to close) for new orders, earning interest but not dividends until they can pull the trigger and once again secure their uncertain future (April 19, 2013, Wall Street Week Ahead: In earnings frenzy, will Apple get crushed?).
In self-defense, we’ve reviewed our portfolios and tightened up our stop/loss prices and rolled our puts & calls forward and upward against the likely onslaught of volatility and “surprise”. We don’t know what they’re going to do when the “frenzy” sets in, or even why they do it notwithstanding the “herding” instinct (please see our recent Post, Earnings Don’t Matter, April 2013, which is very specific about that).
The Exhibits below tabulate the current status of The Perpetual Bond™ in each of these markets. If a company is not listed there, then it’s not in the Perpetual Bond™ at this time, but we might have talked about it in one of these Posts (please try the Search box or send us an email at RiskWerk@gmail.com if you want to know what we think). Our view is that we must be in the market at all times, with as much money as possible, but we also need to know where we’re “standing” – above or below the price of risk – so that we’re not bushwhacked by the day-to-day volatility of stock prices or made-in-the market “surprise”. Moreover, whereas most investors will be focused and expectant on the income statement and forecasts of future earnings, we only care about the quarterly balance sheet, knowing that the balance sheet is the “acorn that becomes the oak”; it is the oak, or the new oak, and the fluttering of its “leaves” (the earnings and the forecast) is just noise . That observation is probably counter-intuitive, but the intuition, or “wish”, is trumped by the much higher standard of the “demonstrated societal standard of risk aversion and bargaining practice”. Please see our Post, The Price of Risk, August 2012, for more information. The “price of risk” is also the stock price that provably obtains a Nash Equilibrium between “risk averse” and “risk seeking” investors (please see our Post, The Nash Equilibrium & Its Stock Price, October 2012).
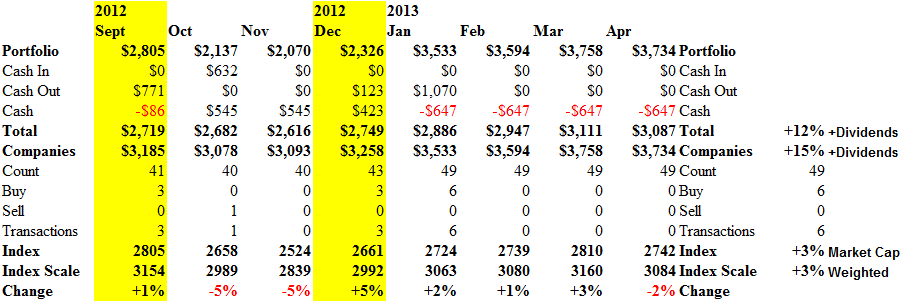
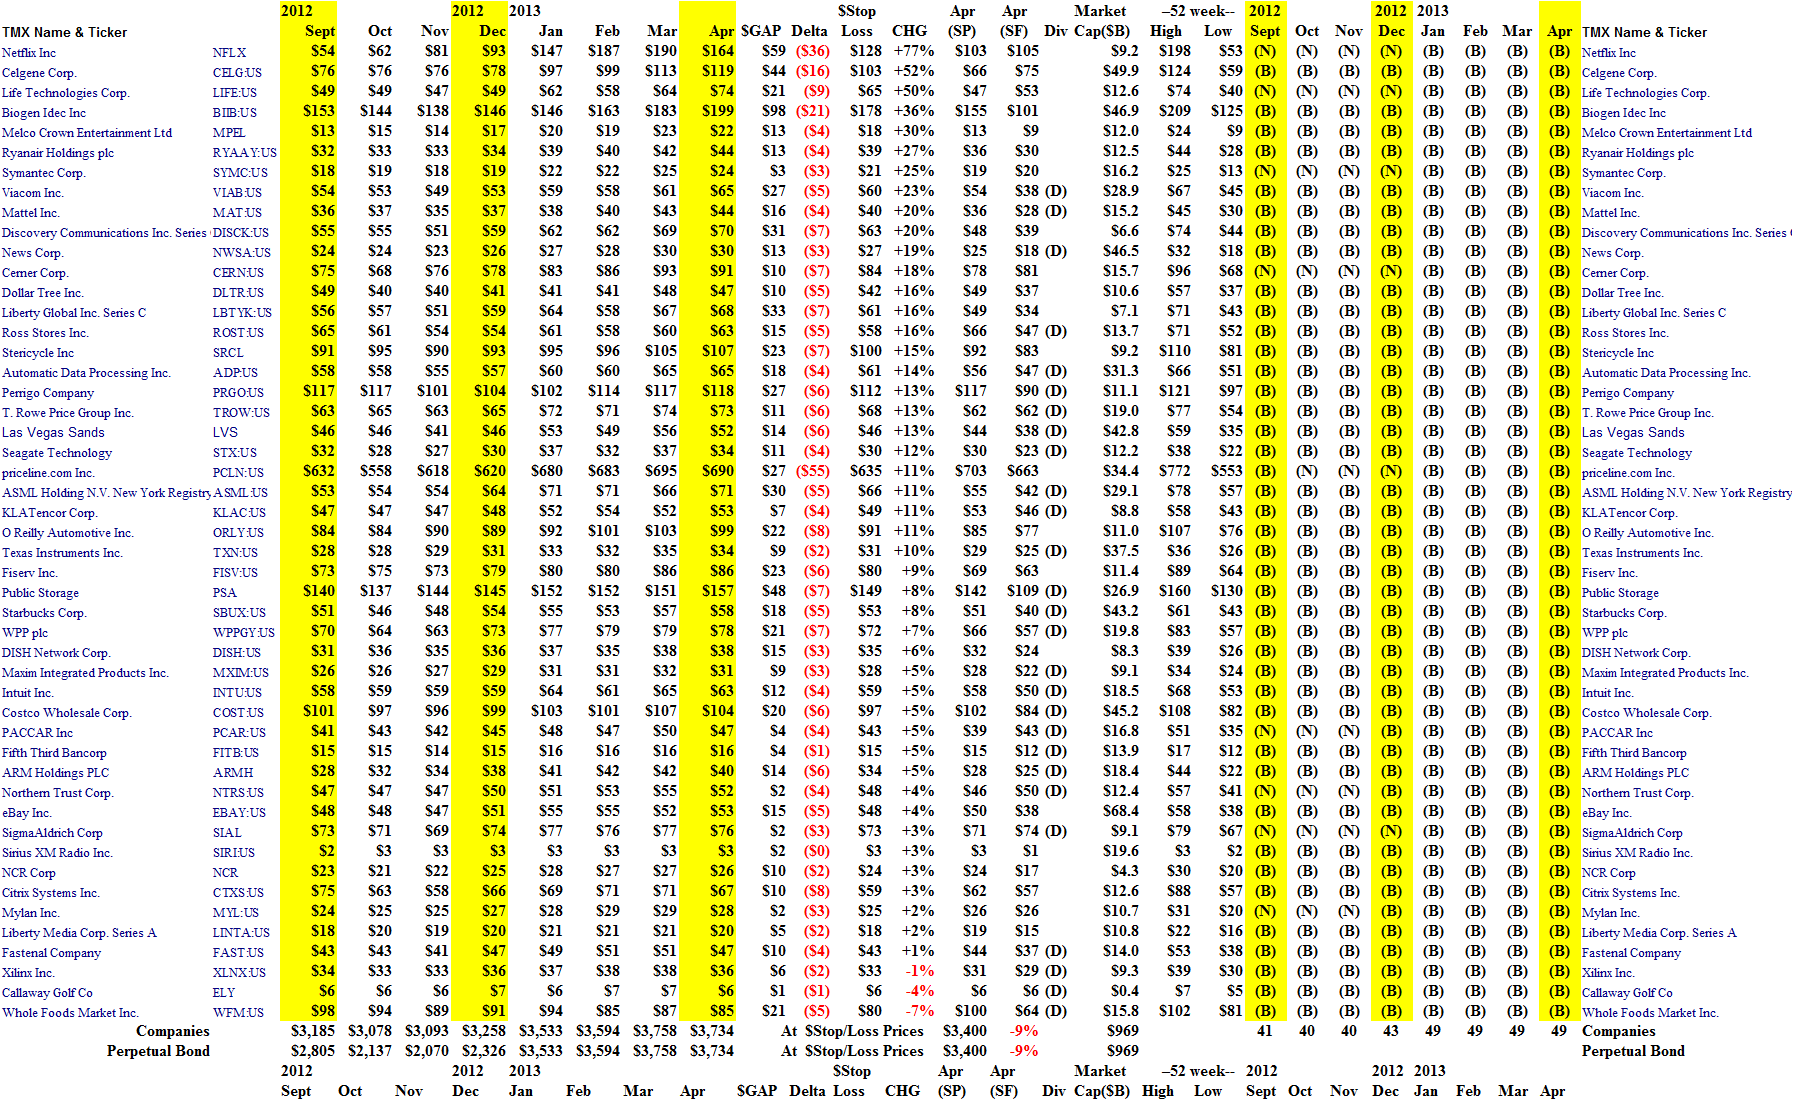
With reference to Exhibit 1 and 2 below, there are currently forty-nine companies in the Nasdaq 100 that are in the Perpetual Bond™ now and have been in the Perpetual Bond™ since at least January; we bought six companies in January to add to the forty-three already there, and none since; please see the Count, Buy and Sell Lines, and Cash In (sold), Cash Out (bought), and Cash Lines (negative entries are the margin account which we use for its convenience); purchases and sales are always in blocks of 1,000 shares for this report, at the market price, and we don’t weight by market capitalization; the units are ($000).
The Perpetual Bond™ in the Nasdaq 100 has returned +12% since the end of December (four months), but we also note that simply buying and holding all the companies (Companies Line) got +15% and the reason is that +3% of the gain is due to the six companies that we bought “late”, in January, at higher prices, rather than in December. (For more details, please see Exhibit 2 below.) For example, three of the companies that we bought in January on an (N)- to (B)-transition – and for no other reason – are Netflix (please see our Post, (B)(N) NFLX Netflix Incorporated, March 2013), Life Technologies (since bought up by the Thermo Fisher Scientific company; please see our Post, (B)(N) TMO Thermo Fisher Scientific Incorporated, April 2013) and Symantec, which gained +77%, +50% and +25%, respectively, since December.
Exhibit 1: The Perpetual Bond™ NASDAQ 100 Companies – Cash Flow Summary – April 2013
The NASDAQ 100 – Cash Flow – April 2013
(Please Click on the Chart to make it larger if required.)
Companies for which the $Stop/Loss price is below the Risk Price (SF) (please see Exhibit 2 below) are particularly vulnerable to volatility because the $Stop/Loss price (which costs nothing to implement) could put us in a loss position if we’re sold out at a price that is lower than what we paid for the stock, and, therefore, it’s worthwhile to consider a “collar” (please see almost any of our (B)(N)-Company posts).
For example, we bought priceline.com Incorporated for $680 in January (on an (N)- to (B)-transition) and it’s currently trading at $690 for a +11% gain, but the $Stop/Loss price is $635 which is below the current Risk Price (SF) of $663 (please see Exhibit 2 below); priceline does not pay a dividend but the July put at $680 sells for $38 today and we can sell or short the July call at $690 against our long position for $37, so that for a net cost of $1 per share today ($38 less $37), we can lock in our price between $680 and $690 for the next three months.
Exhibit 2: The Perpetual Bond™ NASDAQ 100 Companies – Portfolio Summary – April 2013
The NASDAQ 100 – Portfolio – April 2013
(Please Click on the Chart to make it larger, and again, if required.)
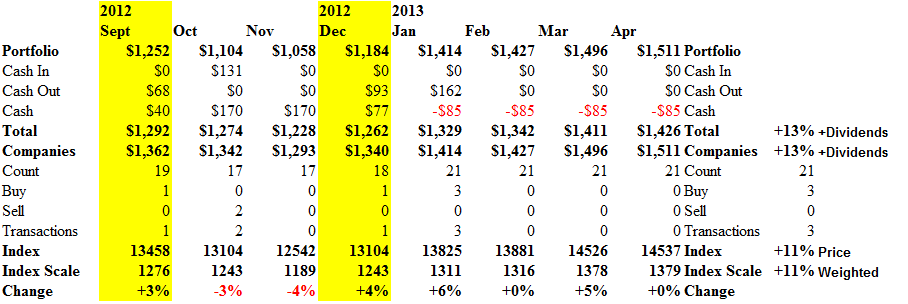
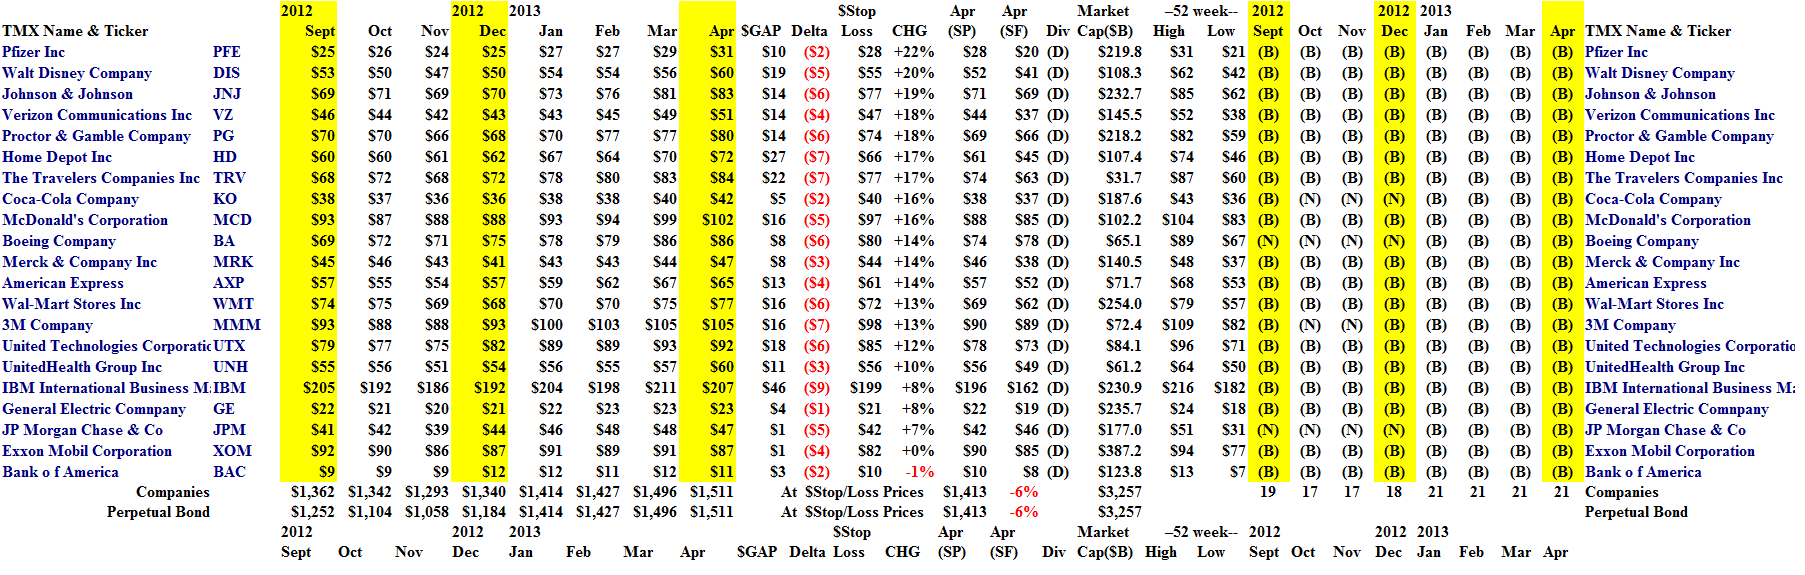
Turning now to the Dow, there are currently twenty-one of the thirty companies in the Dow Jones Industrial Companies in the Perpetual Bond™ (please see Exhibit 3 below). Caterpillar, DuPont, United Technologies, Travelers, Boeing, Proctor & Gamble, Chevron, and Exxon, are expected to stand up next week and explain themselves; we don’t know why they should, but for tradition – investors can read and make up their own stories, can’t they – and they’re all in the Perpetual Bond™ except for Chevron and DuPont; and they’re all up in the double digits (except for Exxon) so far this year (please see Exhibit 4 below).
We like their dividends too, and we’ve put in an option program to protect our gains, and paid for them with a small fraction of our gains when necessary. The options are always a “collar” on our long position, and can be “worked” for profit as more information becomes available. Thank you very much, guys, that’s a great market that you’ve created with your Black & Scholes handbook. Please see our earlier Posts on volatility, such as Volatility for the Delta Challenged, or Run, Rabbit! Run, both in June 2012, for more information; or any of the Hedge Funds Bushwacked By Volatility posts; Popoviciu’s Volatility, October 2012, also explains a very simple but provably competent way in which to estimate the quarterly volatility of stock prices, rather than of returns which are microscopically fundamental to the Black & Scholes methods; we don’t care about returns or their volatility, and they don’t have much to do with investment risk management. They’re just noise, and easily baffled, but if we do nothing but simply set the $Stop/Loss price for all of the companies in the Perpetual Bond™, and all of the prices drop to below the $Stop/Loss (in a market melt-down), then the portfolio would be sold out for $1,413,000 and a loss of minus (6%) from its current value of $1,511,000. Please see the bottom line of Exhibit 4 below.
We also note that simply buying and holding all of the stocks in the Dow is, generally, not a bad policy for investments of almost any size. For example, it would have cost us $1,340,000 in December to buy blocks of 1,000 shares in each of the twenty-one companies (not all thirty, please see below) that are now in the Bond, and that portfolio is now worth $1,511,000 for a +13% gain, plus dividends, whereas “buying the index” which is magically “price weighted” by the actual stock prices (and is equivalent to buying the same number of shares of each of them), has returned +11% and no dividends. Please see Exhibit 3 below, and some of our earlier Posts on What’s A Girl To Do? in June 2012, or January and April, 2013.
Exhibit 3: The Perpetual Bond™ Dow Jones Industrial Companies – Cash Flow Summary – April 2013
The Dow Jones Industrial Companies – Cash Flow – April 2013
(Please Click on the Chart to make it larger if required.)
Exhibit 4: The Perpetual Bond™ Dow Jones Industrial Companies – Portfolio Summary – April 2013
The Dow Jones Industrial Companies – Portfolio – April 2013
(Please Click on the Chart to make it larger, and again, if required.)
Similarly, the Perpetual Bond™ in the S&P 500 Companies currently has 236 companies in it and has returned +13% since the beginning of the year. Please see Exhibit 5 and 6 below.
Exhibit 5: The Perpetual Bond™ S&P 500 Companies – Cash Flow Summary – April 2013
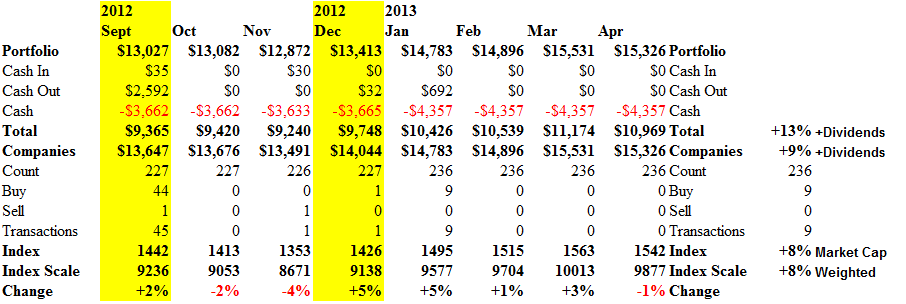
S&P 500 Companies – Cash Flow – April 2013
(Please Click on the Chart to make it larger if required.)
Exhibit 6: The Perpetual Bond™ S&P 500 Companies – Portfolio Summary – April 2013
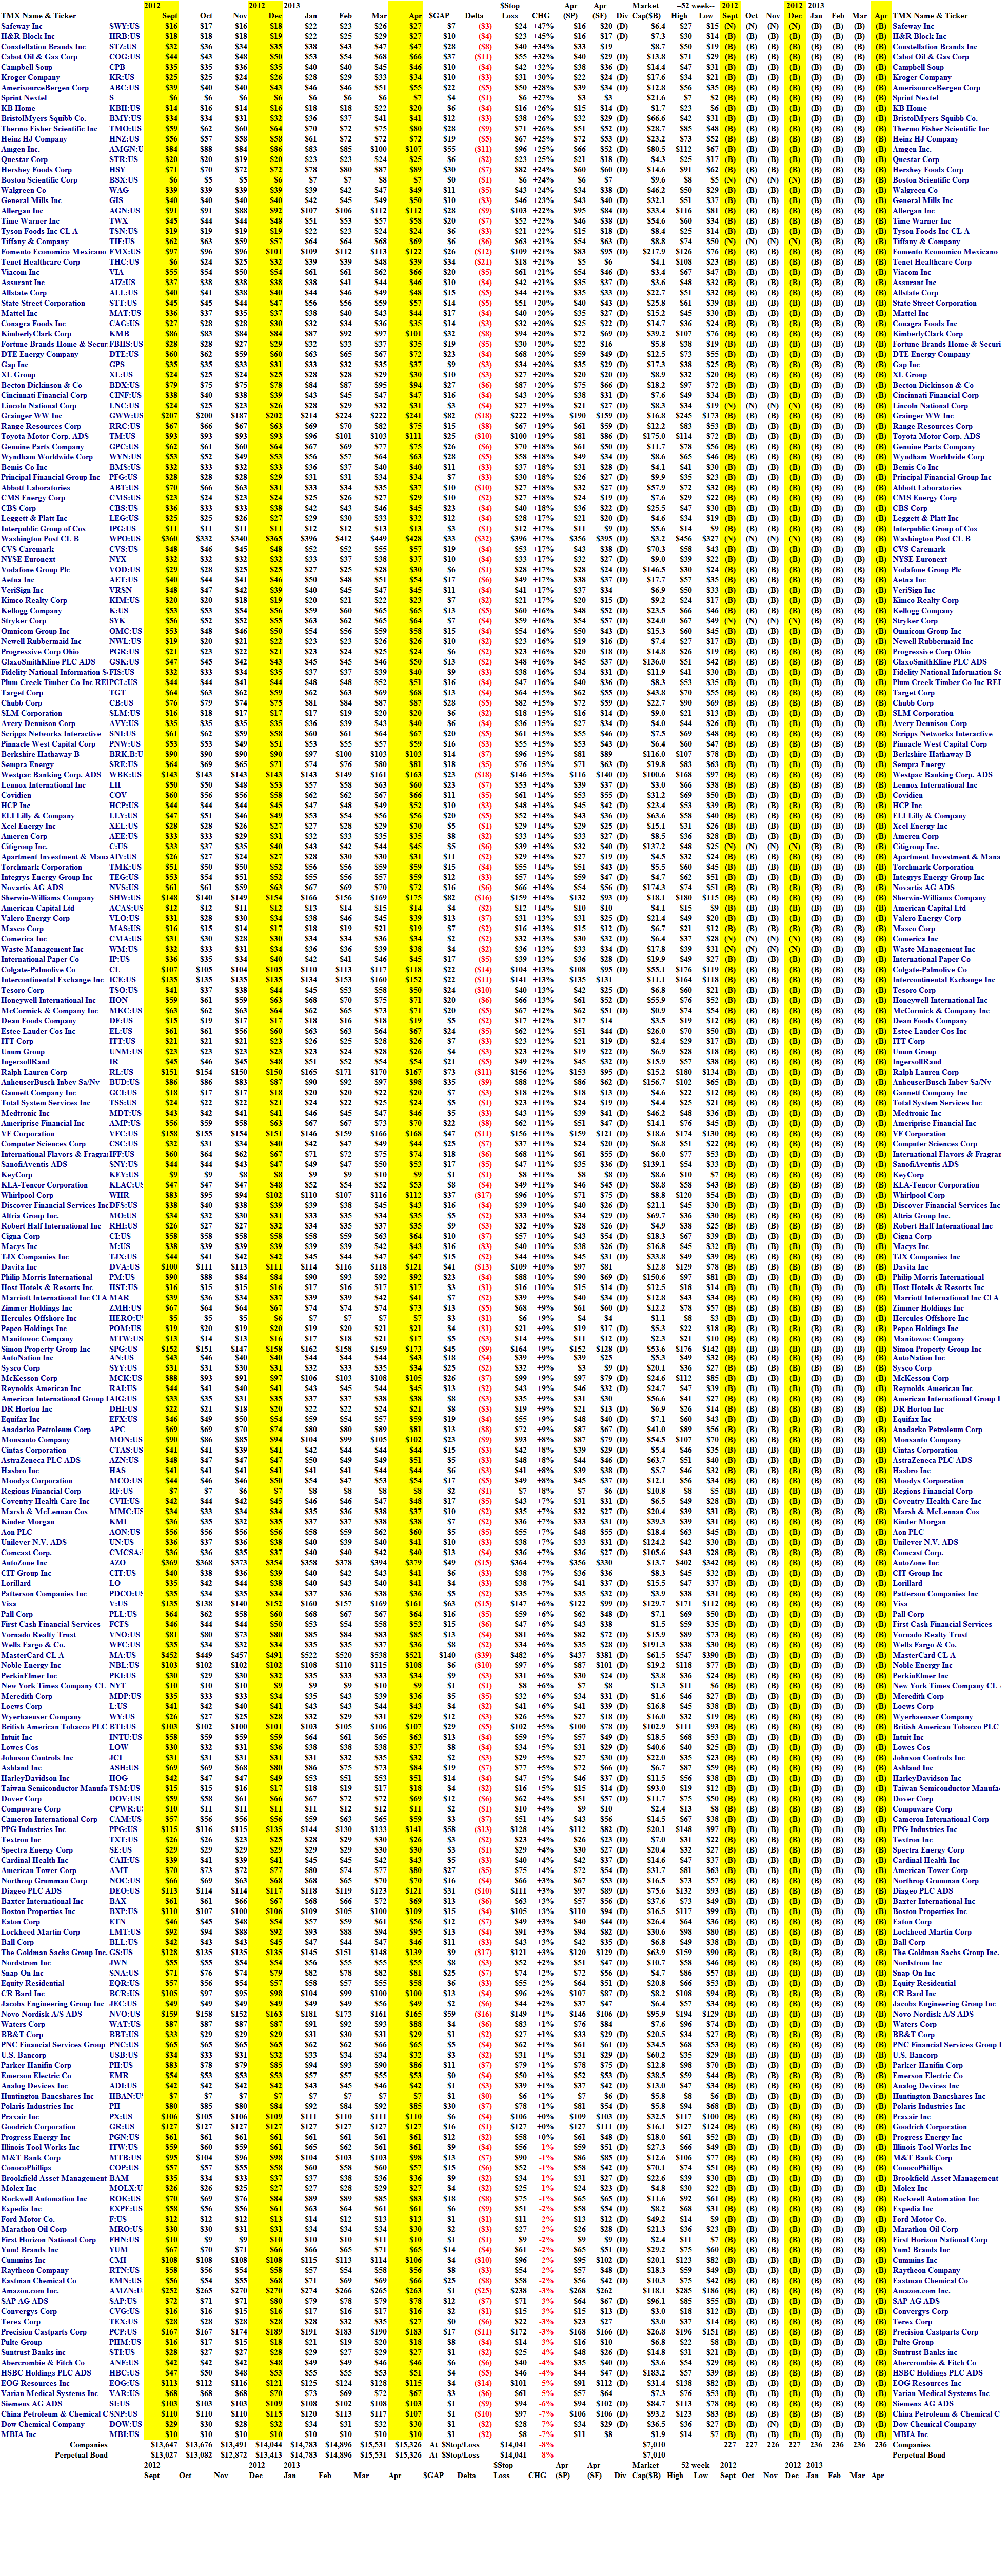
S&P 500 Companies – Portfolio – April 2013
(Please Click on the Chart to make it larger, and again, if required.)
And although the S&P TSX Composite is down minus (4%) since the beginning of the year, the Perpetual Bond™ is up +13% and currently has 82 companies in it, twelve of which we bought in January.
Exhibit 7: The Perpetual Bond™ S&P/TSX Companies – Cash Flow Summary – April 2013

S&P TSX Composite Companies – Cash Flow – April 2013
(Please Click on the Chart to make it larger if required.)
Exhibit 8: The Perpetual Bond™ S&P/TSX Companies – Portfolio Summary – April 2013

S&P TSX Composite Companies – Portfolio – April 2013
(Please Click on the Chart to make it larger, and again, if required.)
In summary, there are currently 388 companies that are in the Perpetual Bond™ with a combined market value of $12 trillion (please see Exhibit 9 below) and which we know, exactly, how to manage regardless of next week’s excess, or the week after. Just 10% on 10% of that really mounts up – $120 billion, this year.
Exhibit 9: The Perpetual Bond™ – April 2013

The Perpetual Bond – April 2013
(Please Click on the Chart to make it larger if required.)
Postscript
We are The RiskWerk Company and care not a jot for mutual funds, hedge funds, “alternative investments”, the “risk/reward equation” and every other unprovable artifact of investment lore. We have just one product
The Perpetual Bond™
“Alpha-smart with 100% Capital Safety and 100% Liquidity”
Guaranteed
With No Fees and No Loads on Capital
For more information on RiskWerk, please follow the Tags or Categories attached to this Letter or simply enter Search for additional references to any term that we have used. Related data may be obtained from us for free in a machine readable format by request to RiskWerk@gmail.com.
Disclaimer
Investing in the bond and stock markets has become a highly regulated and litigious industry but despite that, there remains only one effective rule and that is caveat emptor or “buyer beware”. Nothing that we say should be construed by any person as advice or a recommendation to buy, sell, hold or avoid the common stock or bonds of any public company at any time for any purpose. That is the law and we fully support and respect that law and regulation in every jurisdiction without exception and without qualification to the best of our knowledge and ability. We can only tell you what we do and why we do it or have done it and we know nothing at all about the future or the future of stock prices of any company nor why they are what they are, now. The author retains all copyrights to his works in this blog and on this website. The Perpetual Bond®™ is a registered trademark and patented technology of The RiskWerk Company and RiskWerk Limited (“Company”) . The Canada Pension Bond®™ and The Medina Bond®™ are registered trademarks or trademarks of the Company as are the words and phrases “Alpha-smart”, “100% Capital Safety”, “100% Liquidity”, ”price of risk”, “risk price”, and the symbols “(B)”, “(N)” and N*.
