(P&I) The Easy (EC) Theory of the Capital Markets

Model-T & Beaver Pelts Safe, Liquid, and Hopeful
Essay. There is no theory of the capital markets and they appear to have developed from the pragmatism of merchants and, later, investors seeking investments, and companies (or governments) seeking capital (or debt). Taverns and inns were the first “banks” because the inn-keeper knew everybody, locally, could provide accommodation, a warehouse, meeting rooms and a safe-box, and had weigh-scales to effect currency exchange because there wasn’t any paper money in Europe until the 17th century.
Massive fortunes are often built on the flimsiest of vehicles, the Model-T (Ford), for example, or “beaver pelts” (Astor), and the words that move us – safe, liquid, and hopeful – certainly pass the “flimsy test” according to Wall Street, which certainly knows “flimsy” and we can buy there as much “risk” as we want, and even more than we want, and so we are well-motivated to check the foundations.
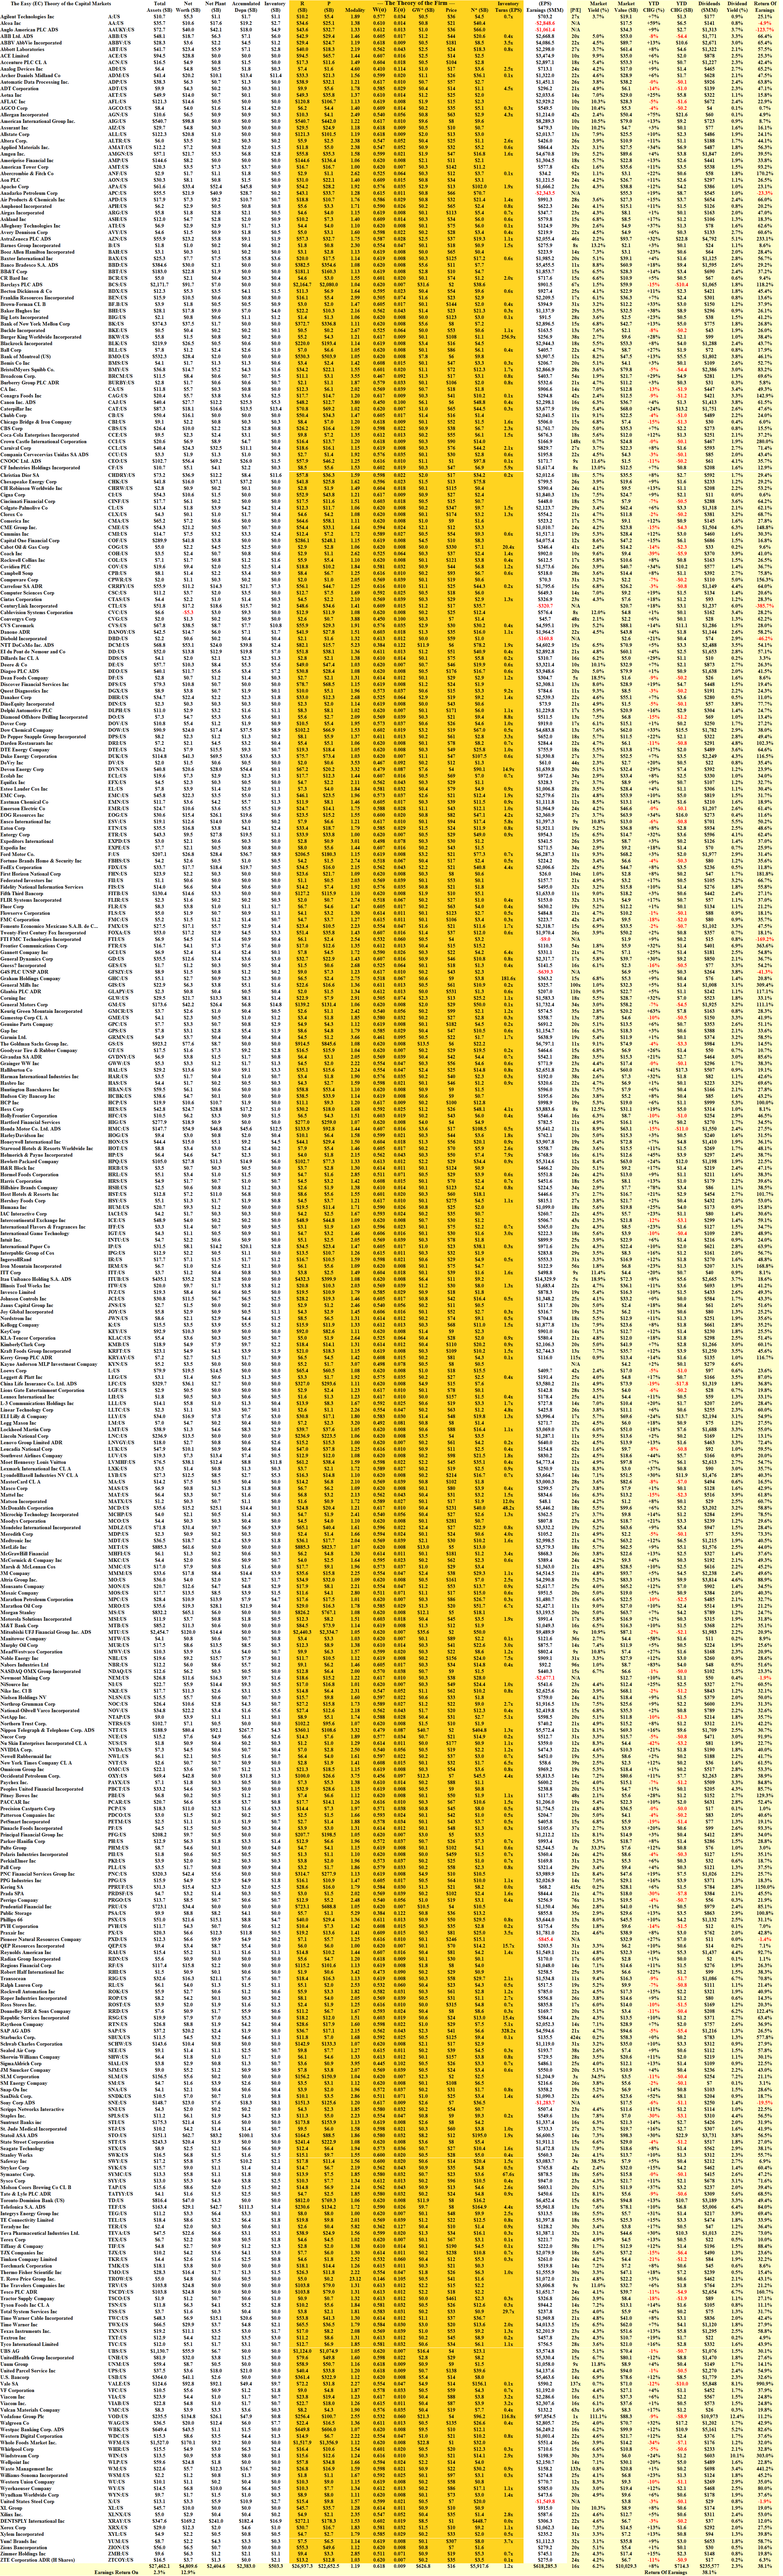
The sample database consists of 390 companies listed in the NYSE and S&P 500 which all have three things in common; their market capitalization is between $1 billion and $100 billion, leaving room for growth; they all pay dividends; and they all have either a Company E (α=1) or Company C(α>1) modality; please see Exhibit 1 below.
From this database, we randomly selected portfolios of 52 companies and tracked the 12-month returns between December 2011 and July 2014 (32 months); each sample portfolio generates twenty 12-month returns in the total market value, and the market value of the (B)-companies and the (N)-companies, with the latter two equally weighted by value, so that, on average, each company makes up about 2% of the portfolio, initially, but that might vary later depending on how well the company does in the market.
Exhibit 1: The Easy (EC) Theory of the Capital Markets – Fundamentals – Summary Data
The Easy (EC) Theory of the Capital Markets – Fundamentals
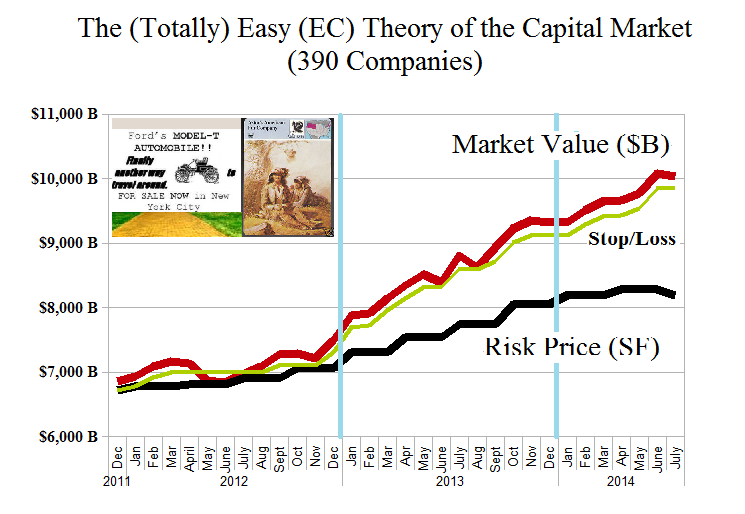
Figure 1.1: The Easy (EC) Theory of the Capital Markets – Risk Price Chart
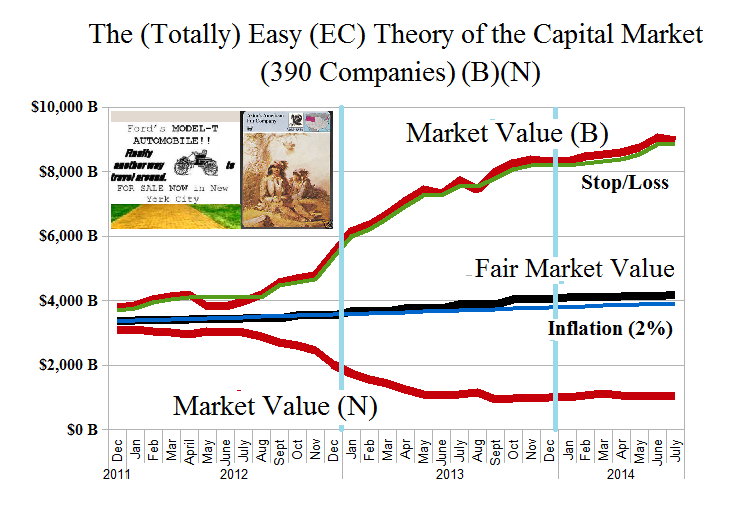
Figure 1.2: The Easy (EC) Theory of the Capital Markets – Fair Value Chart
The portfolio on the left (Figure 1.1) just buys and holds all of the companies based on our budget and a flat percentage by market value; the value is always maintained , or increased, in cash and stocks by an attentive stop/loss policy, and the risk price can be used to help decide whether or not to buy back some of these stocks at a lower price.
The portfolio gained +9% in 2012, +24% in 2013, and is up another +8% so far this year, plus dividends which were in aggregate $236 billion for a return of earnings of 38% and an aggregate yield of 2.3%; please see Exhibit 1 above for further summary details, and click on the link (and again to make it larger if required) “The (Totally) Easy (EC) Theory of the Capital Market” for all the details.
However, a portfolio and a method does not make a capital markets theory, although we note that a 10% gain on the current value of $10 trillion will require $1 trillion in new money, whereas a 10% gain early last year cost only $800 billion, and only $700 billion in early 2012; if the market appears to be slowing down, there might be other reasons than problems in China, et cetera, because it needs more money, and some managers will take profits and buy in the low-priced (N)-company portfolio, for example. But for more on that policy, please see below.
The Perpetual Bond™ (Figure 1.2 Market Value (B)) with the same discipline with respect to the market value, but a more active buy and sell policy respecting the price of risk, returned +44% in 2012, +52% in 2013, and is up another +8% so far this year; the same decisions, but applied to the equal-weighted-by-value portfolio, gave us +46% in 2012, +51% last year and is up another +16% so far this year; and we don’t give any money back.
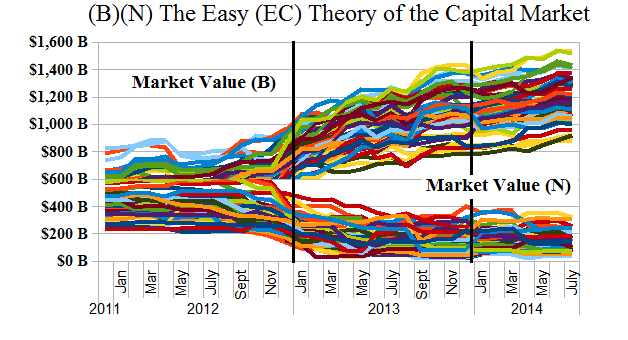
Figure 2.1: The Easy (EC) Theory of the Capital Markets – (B)(N)
But not everything is simple, or “flimsy”, under the “safe, liquid, and hopeful” banner.
In the interests of a provable theory of the capital markets, in this context, we ran simulations involving fifty randomly-selected portfolios of fifty-two companies each from this domain of 390 companies, above, and the results are for the (B)(N)-style of management by market value (as in Figure 1.2 above) and are shown in Figure 2.1 on the left.
Moreover, we didn’t just start each of the fifty portfolios once in December 2011, but we started them for each month forward so that we could tabulate 12-month returns for over 1,000 portfolios, with fifty portfolios starting in every month until a year ago.
The statistics confirm the separation with better than 99.9% certainty (a t-test with paired values from the rolling 12-month returns of the (B)- and (N)-portfolios), but since a market like that of 2012 will undoubtedly arrive soon, what can we say about it? And how will the market close the gap between the (B)- and the (N)-companies which now stands at about $1 trillion in just those companies which, by market value, make-up only about a tenth of the whole market (although the domain at $10 trillion (Figure 1.1) makes up about half of it)?
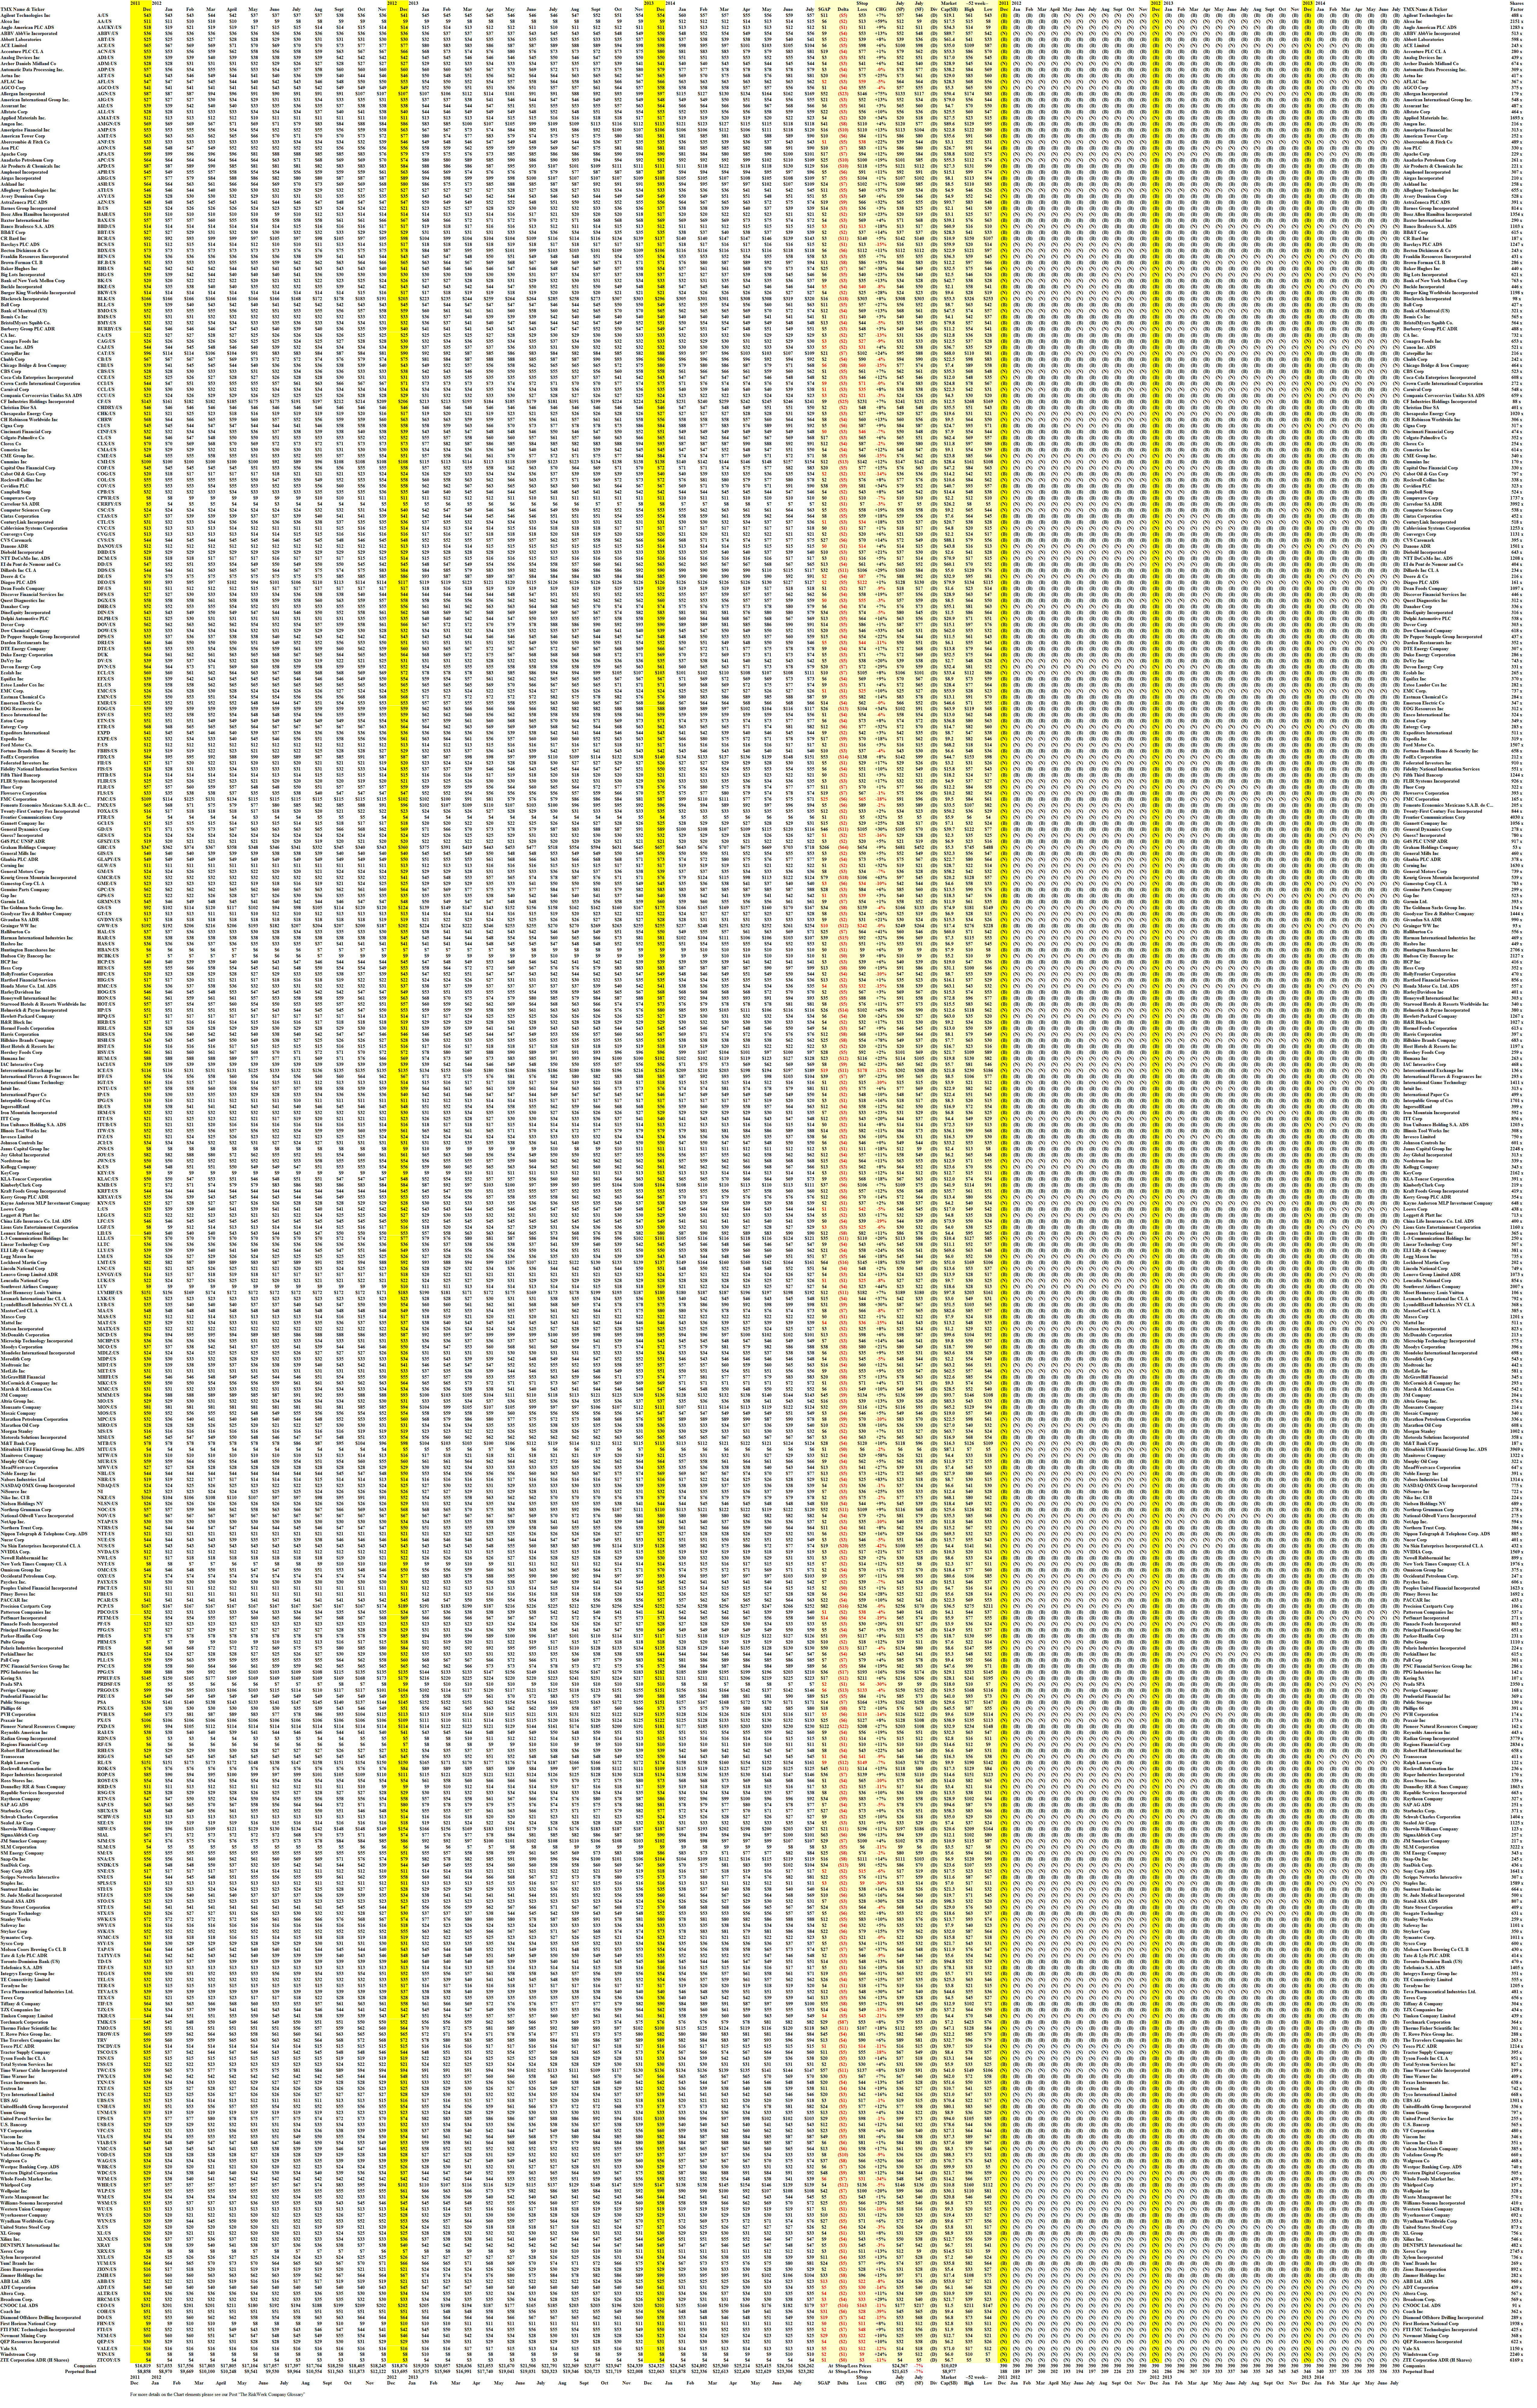
The reason for the apparent collapse of the “(N)-class” companies (a new jargon, (N)-class and (B)-class) is not that the prices faded, but that they were being bid-up into the (B)-class so that the number of companies in the portfolio and, therefore, its market value, was declining even if the prices of what was left were not declining; please see Figure 2.2 below and for all the details, please click on the link (and again if required to make it larger) “The (Totally) Easy (EC) Theory of the Capital Market – Prices & Portfolio“.
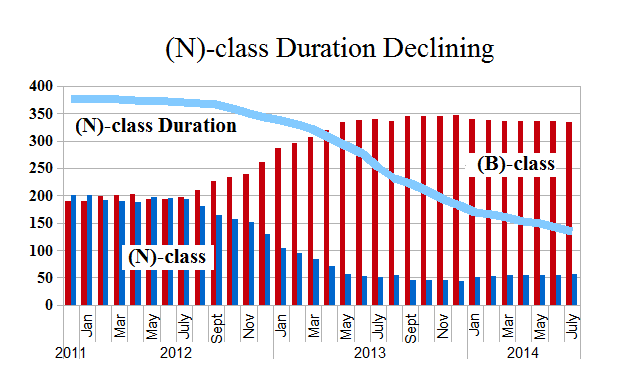
Figure 2.2: (N)-class Duration
Starting at the left of Figure 2.2, there are 376 companies (of 390) that have been (B)-class for one month or more of the thirty-two months between December 2011 and July 2014, and the balance, fourteen of 390 (above the blue line) that have never been (B)-class but are always (N)-class during this period.
Thereafter, the number of companies that spend all of their time in the (N)-class and none of their time in the (B)-class is declining as more (N)-class companies are “promoted” to the (B)-class for at least some of the time; the right-hand side of the chart indicates 135 companies which are never (N)-class and always (B)-class during the entire interval of 32 months; for more details, please see the link above.
However, these companies, as (EC)-companies, are all the same from a financial point of view, because they all pay dividends and have the wherewithal to do it even if the earnings are slack for a time – if R is “what is owed to the company” (please see The Theory of the Firm) and P is “what the company owes” (its total liabilities), then the modality is α=R/P≥1, and in most cases, substantially greater than one (please see the link above); nevertheless, 145 companies have “migrated” from (N)-class to (B)-class during this period, and there’s no reason that they shouldn’t stay there. But will they?
From a practical point of view, we don’t have to guess, nor can we guess because there are as many reasons that investors might bid a stock price up or down as there are investors; all we have to do is protect the prices that we have in the (B)-class companies with an attentive stop/loss or target price below the current stock price (as in the green line in Figure 1.1 and 1.2) which is something that we can’t do for the (N)-class companies because they are always “overvalued” no matter how low the price, or how good are the “financials” or prospects.
In the simulations that led to Figure 2.1 above, the (N)-company portfolios had an average return of minus (-33%), but a volatility (standard deviation) of 62% and a standard error of 2% meaning that 95% of the time we can expect them to trade within 4% of the current stock price but, obviously, it’s the other 5% of the time that “things” really happen. In contrast, the (B)-company portfolios had an average return of +56% with a standard deviation of 38% and a standard error of 1.2%, and we know how to protect the prices.

Safe, Liquid, and Hopeful.
If the investors decide to take profits, where are they going to put it, because there’s $1 trillion in “profits” in this class (the (EC)-class) alone and the total value of the remaining (N)-class companies is just $1 trillion, which leaves bonds and the other two classes of companies, Company A and Company B, which are more “complicated” than the (EC)-companies and have a current market value of about $10 trillion.
And, therefore, the investors are waiting and watching, because absent the price of risk, they don’t know where they are.
For more applications of these concepts please see our Posts which rely on the Theory of the Firm developed by the author (Goetze 2006) which calibrates The Process to the units of the balance sheet and demonstrates the price of risk as the solution to a Nash Equilibrium between “risk-seeking” and “risk-averse” investors within the demonstrated societal norms of risk aversion and bargaining practice. And for more on The Process, please see our Posts The Food Chain and The Process End-Of-Process.
And for more information on real “risk management” and additional references to the theory and how to read the charts and tables, please see our Post, The RiskWerk Company Glossary; we’ve also profiled hundreds of companies in these Posts and the Search Box (upper right) might help you to find what you’re looking for.
And for more on what risk averse investing has done for us this year, please see our recent Posts on The S&P TSX “Hangdog” Market or The Wall Street Put or specialty markets such as The Dow Transports & Utilities or (B)(N) The Woods Are Burning, or for the real class action, La Dolce Vita – Let’s Do Prada! and It’s For You, Dear on the smartphone business.
And for more stocks at high prices, The World’s Most Talked About Stocks or Earnings Don’t Matter – NASDAQ 100. And for more on what’s Working in America, Big Oil, Shopping in America or Banking in America, to name just a few.
Postscript
We are The RiskWerk Company and care not a jot for mutual funds, hedge funds, “alternative investments”, the “risk/reward equation” and every other unprovable artifact of investment lore. We have just one product
The Perpetual Bond™
Alpha-smart with 100% Capital Safety and 100% Liquidity
Guaranteed
With No Fees and No Loads on Capital
For more information on RiskWerk, please follow the Tags or Categories attached to this Letter or simply enter Search for additional references to any term that we have used. Related data may be obtained from us for free in a machine readable format by request to RiskWerk@gmail.com.
Disclaimer
Investing in the bond and stock markets has become a highly regulated and litigious industry but despite that, there remains only one effective rule and that is caveat emptor or “buyer beware”. Nothing that we say should be construed by any person as advice or a recommendation to buy, sell, hold or avoid the common stock or bonds of any public company at any time for any purpose. That is the law and we fully support and respect that law and regulation in every jurisdiction without exception and without qualification to the best of our knowledge and ability. We can only tell you what we do and why we do it or have done it and we know nothing at all about the future or the future of stock prices of any company nor why they are what they are, now. The author retains all copyrights to his works in this blog and on this website. The Perpetual Bond®™ is a registered trademark and patented technology of The RiskWerk Company and RiskWerk Limited (“Company”) . The Canada Pension Bond®™ and The Medina Bond®™ are registered trademarks or trademarks of the Company as are the words and phrases “Alpha-smart”, “100% Capital Safety”, “100% Liquidity”, ”price of risk”, “risk price”, and the symbols “(B)”, “(N)” and N*.
