(P&I) The Razor’s Edge & The Market Bubble

What does it mean? Courtesy: 2001 A Space Odyssey (1968)
Drama. The S&P 100 companies provide a “risk-free rate of return” that we call the “Free Market Yield” and we can say with full confidence that it is 0.689% or 68.9 basis points today and that is a number that’s hard to change and rather low – but what does it mean?
And why is it so low when the markets have done so well for the past several years? Why shouldn’t we expect that the markets will return more than 68.9 basis points this year – a mere pittance – if the stock prices are increasing so much more than that?
And how can we lose so much more if these same markets go the other way?
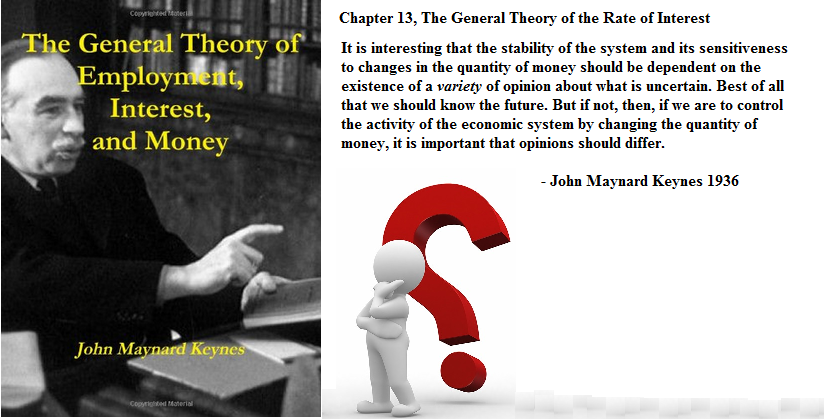
Figure 1: Keynes General Theory
The answers to these questions are easily drummed-out by the investment noise that we call “volatility” but the same question – why – was asked and answered more than seventy years ago by Mr. Keynes in the context of monetary theory; please see Figure 1 on the right.
And although we don’t expect to change investor behavior anymore than he did, we can be fairly certain that having expressed their opinion once (and even more than once) by what they are prepared to buy and hold at the current prices, what reason should we have to doubt them and that they might change that opinion and do something else?
None and that’s the reason that the “Free Market Yield” is a market invariant in so far as anything can be said about the markets that is a certainty; please see below for more details and how that information can be used to improve our investment experience.
Investor Risk Tolerance & Liquidity
All investors are (or ought to be) risk averse in that it’s not our intention to lose our money or to obtain a rate of return that is less than the rate of inflation; on the other hand, we need to invest and take that chance because our money as cash is a near certain loss.
However, an investor might have a low tolerance for risk if liquidity is an issue and there is a demand for an income, and they will therefore tend to buy those stocks that tend to produce, and have produced, the highest return per unit of risk or by implication, the least risk per unit of return and, as we’ll see below, “the lowest price per unit of risk” all of which are equivalent if all we’re concerned about is “volatility”.
On the other hand, an investor for whom liquidity requirements are less pressing might be said to be a high risk tolerant investor and tend to buy those stocks that produce the least return per unit of risk, which sounds odd until we recast it as the “highest risk per unit of return” in the certainty that if the stock price moves against them they don’t need to sell at low prices in the absence of liquidity concerns and exogenous factors (“surprise”) that might permanently impair the value of their investment, but they’ll be there in the event that the stock price moves with them and upwards more than the others and, in particular, more than those stocks that are held by the low risk tolerant investor as providing the least “risk” per unit of return at the lowest price.
However, there’s no free lunch because the high risk tolerant investor will also be paying the “highest price per unit of risk” because the high risk tolerant investor is in the business of buying risk and although it’s almost free for those who don’t want it, it doesn’t come cheap for those who do.
And this is where we diverge from the “volatility-bound” investor: an investor who sees “risk” only (or substantially) as “volatility” whether they are low risk tolerant or high risk tolerant (as above) will get what they asked for but neither policy has an advantage over the other in terms of reliable and realizable investment returns because what we really want is a 100% capital guarantee and a hopeful but not necessarily guaranteed non-negative real return – but what we get by “taming” risk as volatility is no more than a gamble and in practice, a “numbers game”; please see below for more on that.
However, on balance, the high risk tolerant investor (who has paid a premium for risk) will tend to do better than the low risk tolerant investor in any market provided that they know how to cap their potential loss (which is higher) and the only cheap and effective policy for that is the stop/loss but the only cheap and effective policy for the stop/loss is to buy and hold only those companies that are trading at or above the “price of risk” regardless of their volatility and their expected “risk-adjusted return”.

The “Righteous” Answer To The Wrong Questions.
That is bad news for a generation of policy-makers in investment management for pension plans and endowment funds who are responsible for hundreds of billions of dollars of lost opportunities and feeble results in the pursuit of “volatility management” and cannot explain their returns other than as a “surprise”.
And it is bad news for a legion of firms that specialize in “risk as volatility management” none of which have any “edge” at all, other than a good story such as “we want the highest return per unit of risk” or “the least risk per unit of return” which both sound good (and are the same) but which are not different from “we want the least return per unit of risk at the highest price” and “the highest risk at the highest price per unit of return” which are also the same but seldom said as such and if liquidity is an issue and they are fond of the “risk/reward equation” they will lose their money over the long-term which could be a lot sooner than they think.
The Classic Hedge
We can implement either policy by using the “Razor’s Edge” to cut the market above and below it and substantially “separate” the low risk tolerant investors (who are above it) from the high risk tolerant investors who are below it (naturally).
We did it twice for the low risk tolerant investors in the S&P 100 companies to obtain a portfolio with fourteen companies in it and a “risk-free return” of 1.824% with a demonstrated annual volatility of 10.28%; and three times for the high risk tolerant investors to obtain a portfolio with twelve companies in it and a similar market value of $1.5 trillion and a “risk-free return” of 0.076% (7.6 basis points) with an annual volatility of 15.47%; and hence, we have two portfolios that are separated by the declared investor behavior towards risk and they have a “risk-free return” of 1.748% (1.824% less 0.076%) or 174.8 basis points between them.
The reason for this difference is that the demonstrated “investor total return on the shareholders equity” is 5.261% in the S&P 100 companies but much higher, 7.477%, in the low risk tolerant portfolio which has 14 companies with a market value of $1.6 trillion, and much lower, 2.416%, in the high risk tolerant portfolio which has twelve companies with a market value of $1.5 trillion and if “volatility” is substantially the only discriminant, investors in the low risk tolerant portfolio tend to pay lower prices whereas the investors in the high risk tolerant portfolio tend to pay higher prices for risk.
That result is not a surprise because the two components of the “investor total return on the shareholders equity”, the Dividend Yield and the Market Yield, vary inversely with the stock price and with each “cut” of the Razor’s Edge the “risk-free return” which is the “Free Market Yield” and is particular to that market and the investors and their money that are in it, increases in the market of the low risk tolerant investors and decreases in the market of the high risk tolerant investors and it could become even negative so that these investors are paying a premium to acquire risk as “the most risk at the highest price per unit of return”.
And since all the variation is in the right direction in each case, it also supports our view that once the investors have said what they will buy and hold at what prices, we should not expect that they will change that opinion or change their behavior towards risk without some new information or new factors that will affect the market.
The classic hedge of the long and short portfolio against volatility will work in this context because these two portfolios are intrinsically antipodal if volatility is the major factor, but the strategy is always in contradiction to the investor preference.
For example, the high risk tolerant investor for whom liquidity is less of a problem would buy and hold the cheaper low risk tolerant portfolio with less volatility and short (sell) the more expensive high risk tolerant portfolio which has an in-built higher volatility and a possible downside that they can afford to wait-out.
On the other hand, the low risk tolerant investor for whom liquidity might be a problem will need to buy and hold the more expensive high risk tolerant portfolio with a higher volatility and short the cheaper low risk tolerant portfolio which has a lower volatility and therefore, less of a downside that might challenge the margin account.

They say it was a “Tsunami” but actually it was a “Ratio”.
If the investors do the reverse, for example, the low risk tolerant investors buy the low risk portfolio and short the high risk portfolio, then they are exposing themselves to a disastrous risk – a tsunami – that could wipe them out; please see Exhibit 1 below for some examples.
The Razor’s Edge & The Market Bubble
One of the properties of the “Free Market Yield” in whatever market it’s in, is that it’s a “market invariant” and both in theory and practice it doesn’t change very much as long as the market prices for the stocks in it vary within the range of their demonstrated volatility which means, currently, that the entire market (the S&P 100 companies) could move up or down by about 14% affecting some stocks more than others as long as their prices remain within the range of their demonstrated volatility and it won’t change the Free Market Yield of 0.689% with an expected “investor total return on the shareholders equity” of 5.261% (as above) which could change as the distribution of prices changes because it is not adjusted for volatility.
In order to change the Free Market Yield, a significant amount of new money and new investors needs to come into the market, or leave it, as in the case of the low and high risk tolerant investor portfolios above, which also creates new opportunities for capital gains and losses that can’t be accounted for by volatility alone but are familiar as “Black Swans” and the alleged “fat tails” that are no fatter than anything else that depends on volatility; please see Exhibit 1 below.
The Free Market Yield is calculated as the market capitalization weighted average of the “investor total return on the shareholders equity” which is the sum of the Dividend Yield and the Market Yield reduced by the dividend payout rate for each company, per unit of volatility; please see our Post “(B)(N) S&P 100 Volatility Risk and The Full Moon” for more details on the Market Yield and the Dividend Yield.

Figure 2: Why is it so low?
Although we don’t expect that the market prices are in any way a “probability distribution”, we can say that having expressed their opinion once by what they are willing to buy and hold at the current prices and demonstrating their current tolerance for risk, what reason do we have that they might change that opinion and suddenly bid prices up or down that are outside of the range of the demonstrated volatility; none but please see Figure 2 on the right for the right answer.
It’s a “Dismal Equation (Ecclesiastes 1:9)” and a rough model for the reasons noted and we need to consider that the markets are also subject to exogenous factors (“surprise”) of which the risk-free bond yield of 25 basis points is one and could change in the more immediate future; moreover, we need to expect that the volatility will change as new prices set new highs and lows as new balance sheets come in and when that happens, it’s a whole new ball game.

Doug Flutie, November 23, 1984, Hail Mary!
Exhibit 1 below shows the performance of the low risk tolerance and high risk tolerance portfolios (as above) as well as realizable but random samples for the company with the lowest price per unit of risk (21st Century Fox) and the highest price per unit of risk (Apache Corporation) and our conclusion is – Hail Mary! – which causes us to wonder why anyone would entrust their hard-earned capital to a volatility-based or “holistic” market model – if it doesn’t guarantee our capital 100% or doesn’t hold-out a reasonable hope for a return above the rate of inflation, we always send it back to its maker that it might be fixed.
In Exhibit 2, we ran these portfolios as (B)-class portfolios and it doesn’t matter whether they are low risk tolerance or high risk tolerance because we have only the “no risk” portfolios except that the alleged high risk portfolio tends to have better returns and there are, therefore, some opportunity costs triggered by the stop/loss that we might have to pick-up another day. Oh well.
Exhibit 1: The Razor’s Edge – Hail Mary!
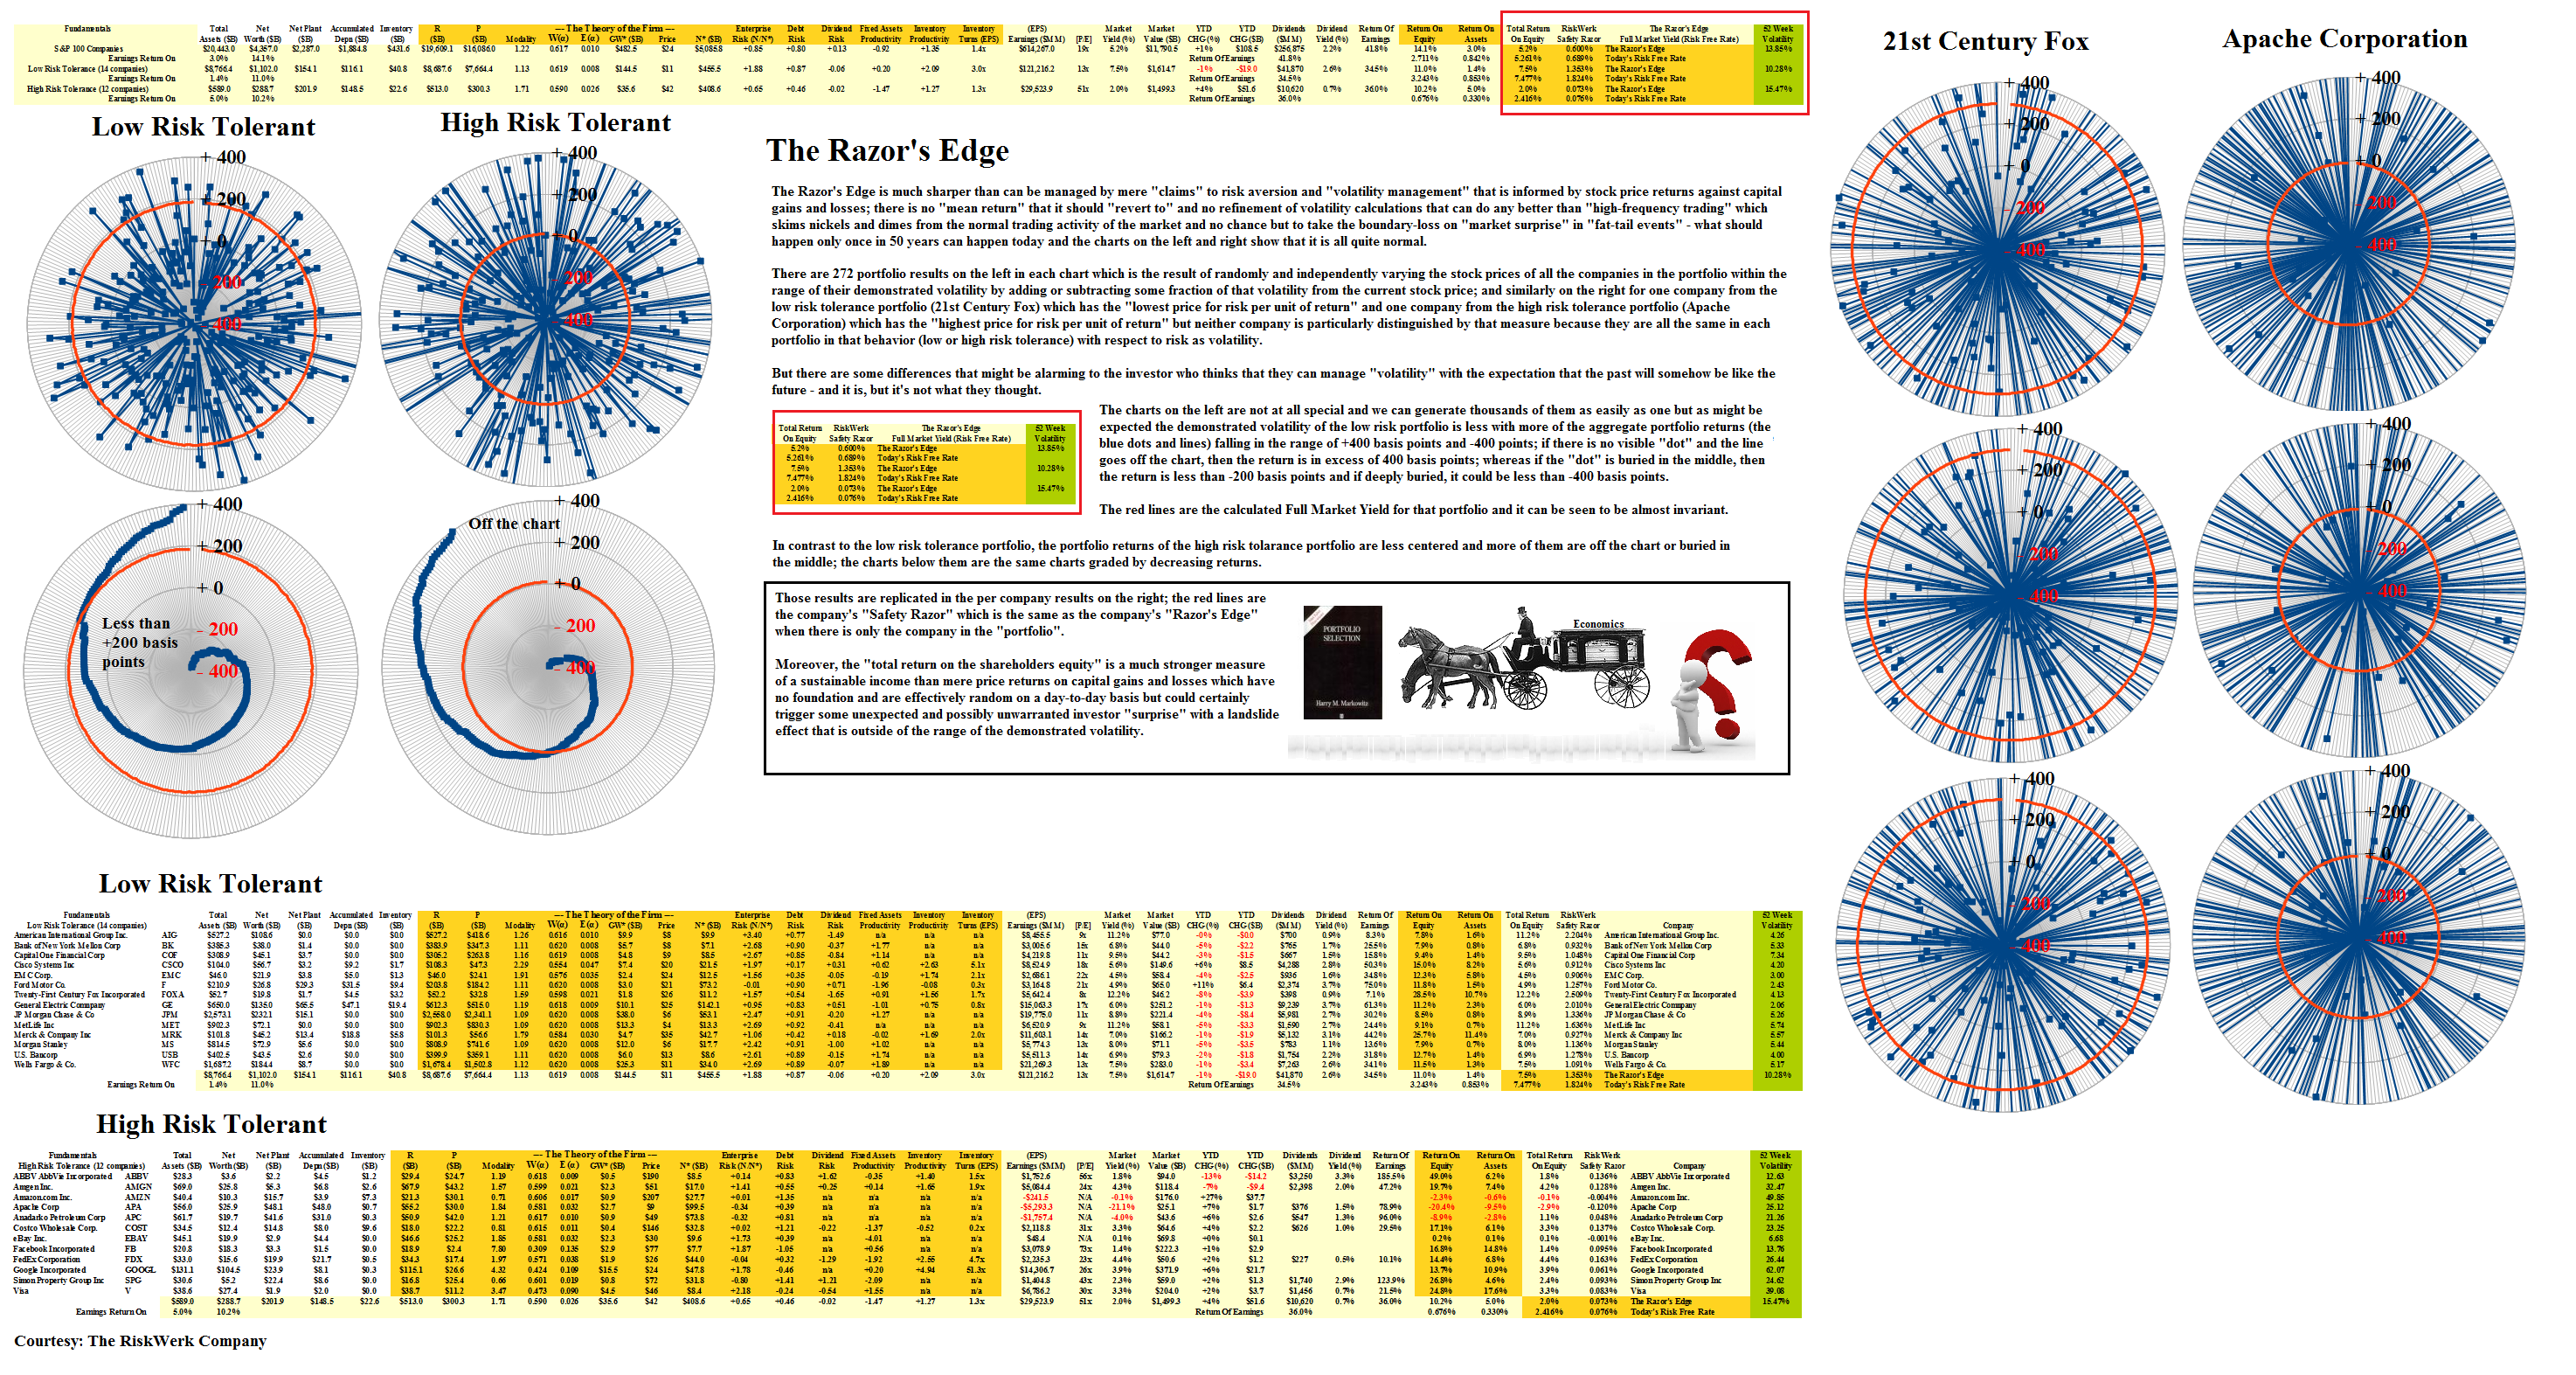
Figure 1.1: S&P 100 Low and High Risk – Fundamentals – Hail Mary!
Exhibit 2: (B)(N) The Low and High Risk (B)-class “No Risk” Portfolios
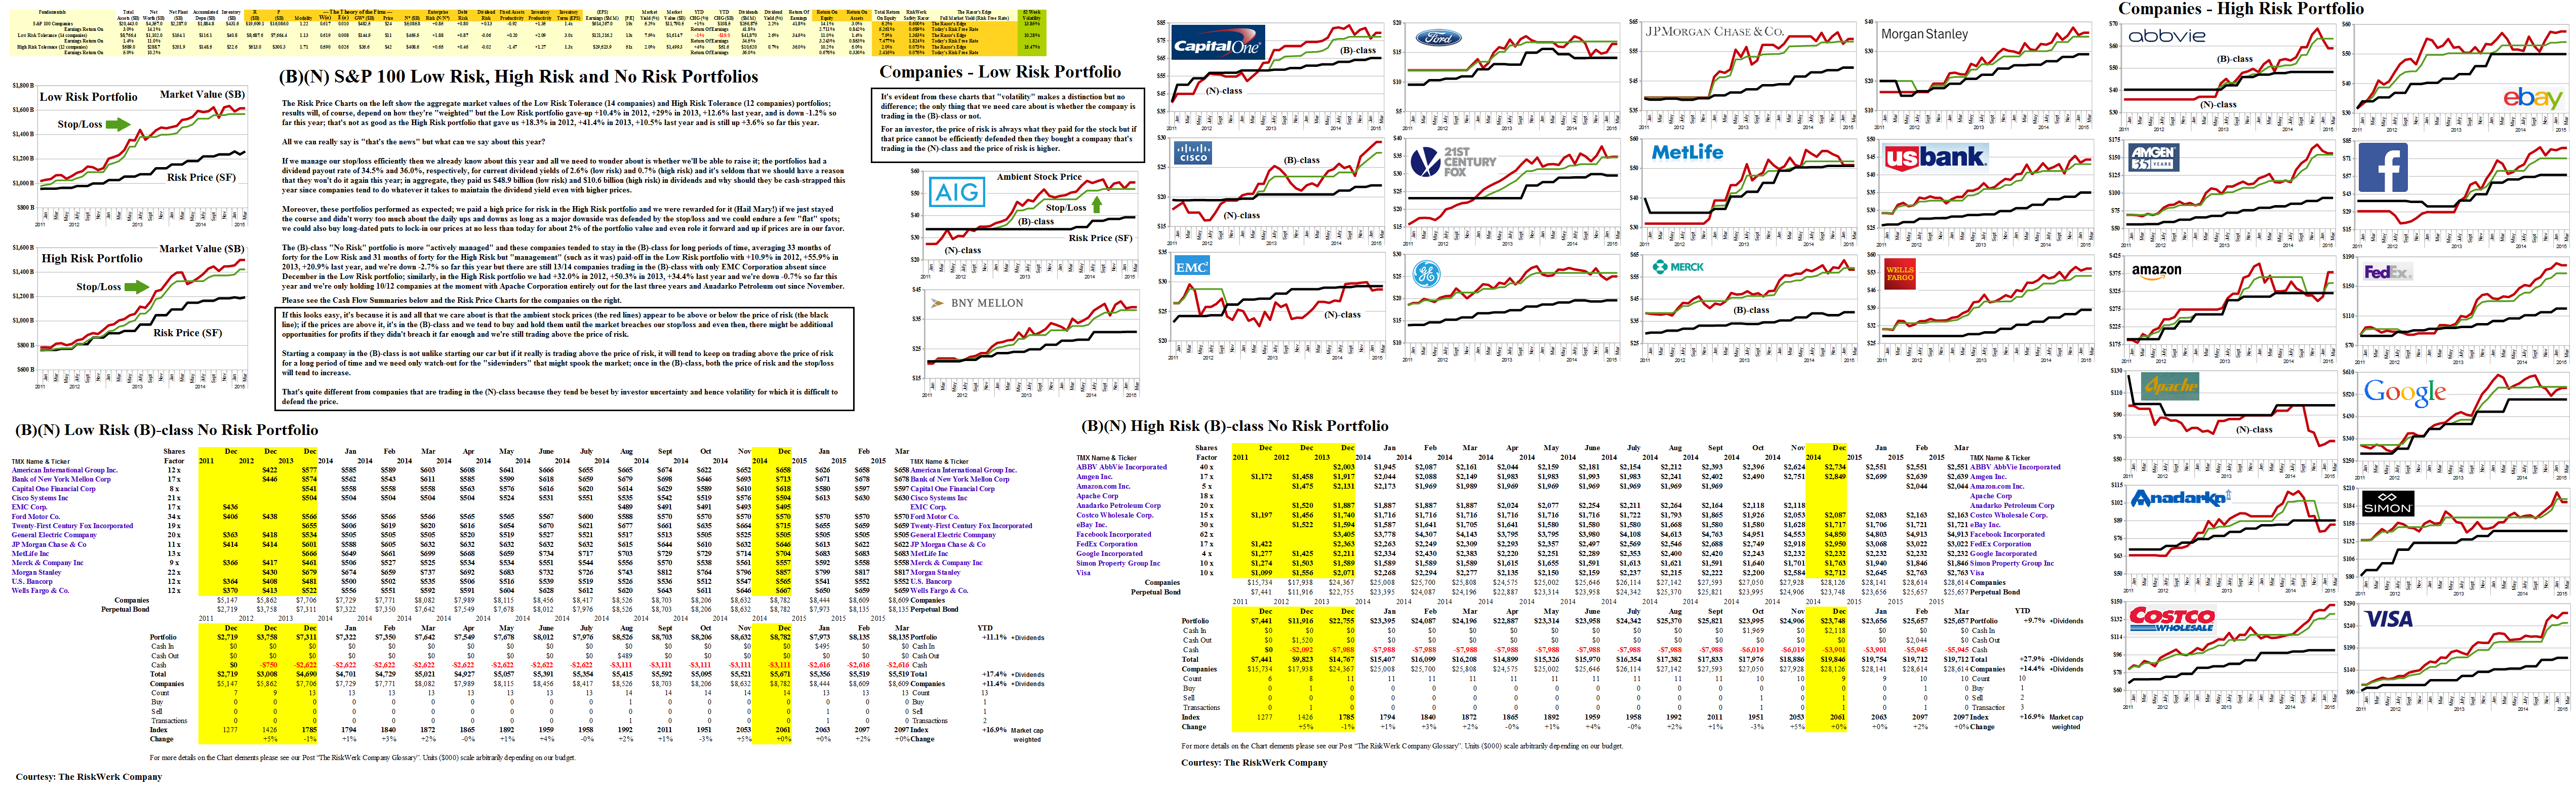
Figure 2.1: (B)(N) S&P 100 Low Risk, High Risk, and No Risk Portfolios

The Right Answer To The Wrong Questions.
These Posts are currently received in over 130 countries Worldwide including Russia, China, India, Japan, Brazil, and the Euro Area countries, and these countries are not dominated by the “Wall Street” model of “risk as volatility” but rather that investment risk is the possibility that we might not get our money back or receive a non-negative real return.
If you are an academic, actuary, or investment manager who is strongly vested in the “risk as volatility” model and the “risk/reward equation” or “risk as value”, consider that the times are changing as in, for example, our recent Post “(B)(N) HPQ Hewlett-Packard Company” and if we can help you to change with them, please write to us at RiskWerk@gmail.com.
For more information on the Equity Market Yield and the terms that we have used above, please see our Posts “(P&I) The Dismal Equation (Ecclesiastes 9:1)” and “(B)(N) S&P 100 Volatility Risk and The Full Moon” and “(B)(N) NASDAQ 100 Volatility and The Stone Bunnies“.
And for more information on real “risk management” in modern times and additional references to the theory and how to read the charts and tables, please see our Post, The RiskWerk Company Glossary and “(P&I) Dividend Risk and Dividend Yield“, and our recent Posts “(P&I) The Profit Box” and “(P&I) The Process – In The Beginning“; and we’ve also profiled hundreds of companies in these Posts and the Search Box (upper right) might help you to find what you’re looking for, such as “(B)(N) TLM Talisman Energy Incorporated” or “(B)(N) ATHN AthenaHealth Incorporated” or “(B)(N) PETM PetSmart Incorporated“, to name just a few.
And for more applications of these concepts please see our Posts which rely on the Theory of the Firm developed by the author (Goetze 2006) which calibrates The Process to the units of the balance sheet and demonstrates the price of risk as the solution to a Nash Equilibrium between “risk-seeking” and “risk-averse” investors within the demonstrated societal norms of risk aversion and bargaining practice. And for more on The Process, please see our Posts The Food Chain and The Process End-Of-Process.
And for more on what risk averse investing has done for us this year, please see our recent Posts on “(P&I) The Easy (EC) Theory of the Capital Markets” or “(B)(N) The Easy (EC) Theory of the S&P 500“, and the past, The S&P TSX “Hangdog” Market or The Wall Street Put or specialty markets such as The Dow Transports & Utilities or (B)(N) The Woods Are Burning, or for the real class action, La Dolce Vita – Let’s Do Prada! and It’s For You, Dear on the smartphone business.
And for more stocks at high prices, The World’s Most Talked About Stocks or Earnings Don’t Matter – NASDAQ 100. And for more on what’s Working in America, Big Oil, Shopping in America or Banking in America, to name just a few.
Postscript
We are The RiskWerk Company and care not a jot for mutual funds, hedge funds, “alternative investments”, the “risk/reward equation” and every other unprovable artifact of investment lore. We have just one product
The Perpetual Bond™
Alpha-smart with 100% Capital Safety and 100% Liquidity
Guaranteed
With No Fees and No Loads on Capital
For more information on RiskWerk, please follow the Tags or Categories attached to this Letter or simply enter Search for additional references to any term that we have used. Related data may be obtained from us for free in a machine readable format by request to RiskWerk@gmail.com.
Disclaimer
Investing in the bond and stock markets has become a highly regulated and litigious industry but despite that, there remains only one effective rule and that is caveat emptor or “buyer beware”. Nothing that we say should be construed by any person as advice or a recommendation to buy, sell, hold or avoid the common stock or bonds of any public company at any time for any purpose. That is the law and we fully support and respect that law and regulation in every jurisdiction without exception and without qualification to the best of our knowledge and ability. We can only tell you what we do and why we do it or have done it and we know nothing at all about the future or the future of stock prices of any company nor why they are what they are now. The author retains all copyrights to his works in this blog and on this website. The Perpetual Bond®™ is a registered trademark and patented technology of The RiskWerk Company and RiskWerk Limited (“Company”) . The Canada Pension Bond®™ and The Medina Bond®™ are registered trademarks or trademarks of the Company as are the words and phrases “Alpha-smart”, “100% Capital Safety”, “100% Liquidity”, ”price of risk”, “risk price”, and the symbols “(B)”, “(N)” and N*.
