(B)(N) The Amazing Story of Berkshire Hathaway

Berkshire Hathaway Incorporated
Drama. Berkshire Hathaway is a “private industrial complex” that doesn’t pay its nominal owners, the shareholders, an income; in order for them to get an income, they need to sell some of their stock to a higher bidder because the company doesn’t pay a dividend to its shareholders (Reuters, February 27, 2015, Buffett says ‘sprawl’ is good, but may not be good enough).
So what else is new? What’s new is that the “investor total return on the shareholders equity” when adjusted for the demonstrated volatility is 0.261% or 26.1 basis points with an annual price volatility of 20.19% which could be reduced to 10% in the next quarter (by one-half not one-quarter – please see our Post “(B)(N) S&P 100 Volatility Risk and The Full Moon” if you’re not sure why).
In other words, Berkshire is operating as a “central bank” (and has the money) which also gives 25 basis points “risk-free” on our money absent capital gains or losses which are obviously more important to the investors but which also depend on the “bank” and how well it performs; please see below for more of the “dazzling” details but we need first to check-out the stock price performance of the company if that’s all we have for an income.
Exhibit 1: (B)(N) BRK.B Berkshire Hathaway Incorporated CL B – Risk Price Chart

Figure 1.1: BRK-B Berkshire Hathaway CL B – Risk Price Chart
The chart on the left is called the “Risk Price Chart” because the two most important lines on it are the ones that we have some insight into – the Risk Price (SF) and the Stop/Loss.
We don’t know anything about the stock price (the red line) except what it is or was and it could be anything for no reason at all (The Tao of Stock Prices (Goetze 2006)) but the Risk Price (SF) (black line) resolves a Nash Equilibrium between “risk seeking” and “risk averse” investors with the primary difference between them being the need for liquidity and therefore their willingness to buy and hold the stock at those prices above the price of risk.
The price of risk is also the “least stock price at which the company is likeable” and why we need to be careful of what we “like” about a company, such as good earnings or good management, to be sure that it’s also “likeable” because “there are as many reasons for a stock price as there are investors and their money (said Tao).”
For example, we never buy for holding a stock that is trading below the price of risk (and therefore “cheap”) because it is provably in the (N)-class and a zone of especial stock price volatility and investor uncertainty that makes it difficult to protect the price that we have with a cheap Stop/Loss (the green line).
For an investor, of course, the “price of risk” is always the price that they paid for the stock but whether it is “the” price of risk depends on whether that price can be reasonably well-defended; if not, then the price of risk is higher and they have a bought a stock that is trading in the (N)-class.
Moreover, the price of risk (Risk Price (SF) which is a calculation) tends to be non-decreasing as the balance sheets of the company “expand” but certain events such a loss of market share or a product failure or new competition or an investment failure in the case at hand, can cause the price of risk to decline or lie fallow for a while.
Berkshire has always been (B)-class in recent times (please see Exhibit 1 above) but the stock price didn’t do much in 2013 even though the company did (the black line) and our stop/loss (the green line) remained more or less where it was until better times in 2014; but in 2013, we didn’t make any money on it – the stock price hardly moved (after March) except for volatility – and to have an income, we needed to buy it by selling some of our stock.
The World Is Not Enough – The Buffett Legacy
Stock prices, of course, are very uncertain – and therefore so is the income if all we have is capital gains or losses – and in the short-term the price could be anything and provide opportunities for both capital gains and losses; but in the long-term there is a more fundamental way to measure the value of the Berkshire Hathaway stock for income by measuring the response of the investor price-making to the “investor total return on the shareholders equity” adjusted for the demonstrated volatility which we call the “Equity Market Yield” (and the “Safety Razor” for any company) and the “Razor’s Edge” for a portfolio of stocks and those values are similar to the aggregate bond yield and market value of a portfolio of bonds except that our assets are stocks.
The Berkshire Hathaway stock has an Equity Market Yield of 0.261% (26.1 basis points which is both its Equity Market Yield and its Razor’s Edge because it is the only company in the “portfolio”) and we can compare that to the portfolio of all the S&P 100 companies which has an Equity Market Yield of 0.689% and because their total returns on the shareholders equity are similar at 6.0% and 5.2%, respectively, we can say that our investment in the Berkshire Hathaway stock is more or less “risky” than holding the entire market if the Equity Market Yield (0.261%) is above the Razor’s Edge for the S&P 100 companies (0.600%) – and therefore less “risky” – or below the Razor’s Edge – “riskier” – which it is; please see Exhibit 2 below for more details on the grim reaper and how it can be defeated if liquidity is not an issue.
Exhibit 2: The World Is Not Enough – The Buffett Legacy
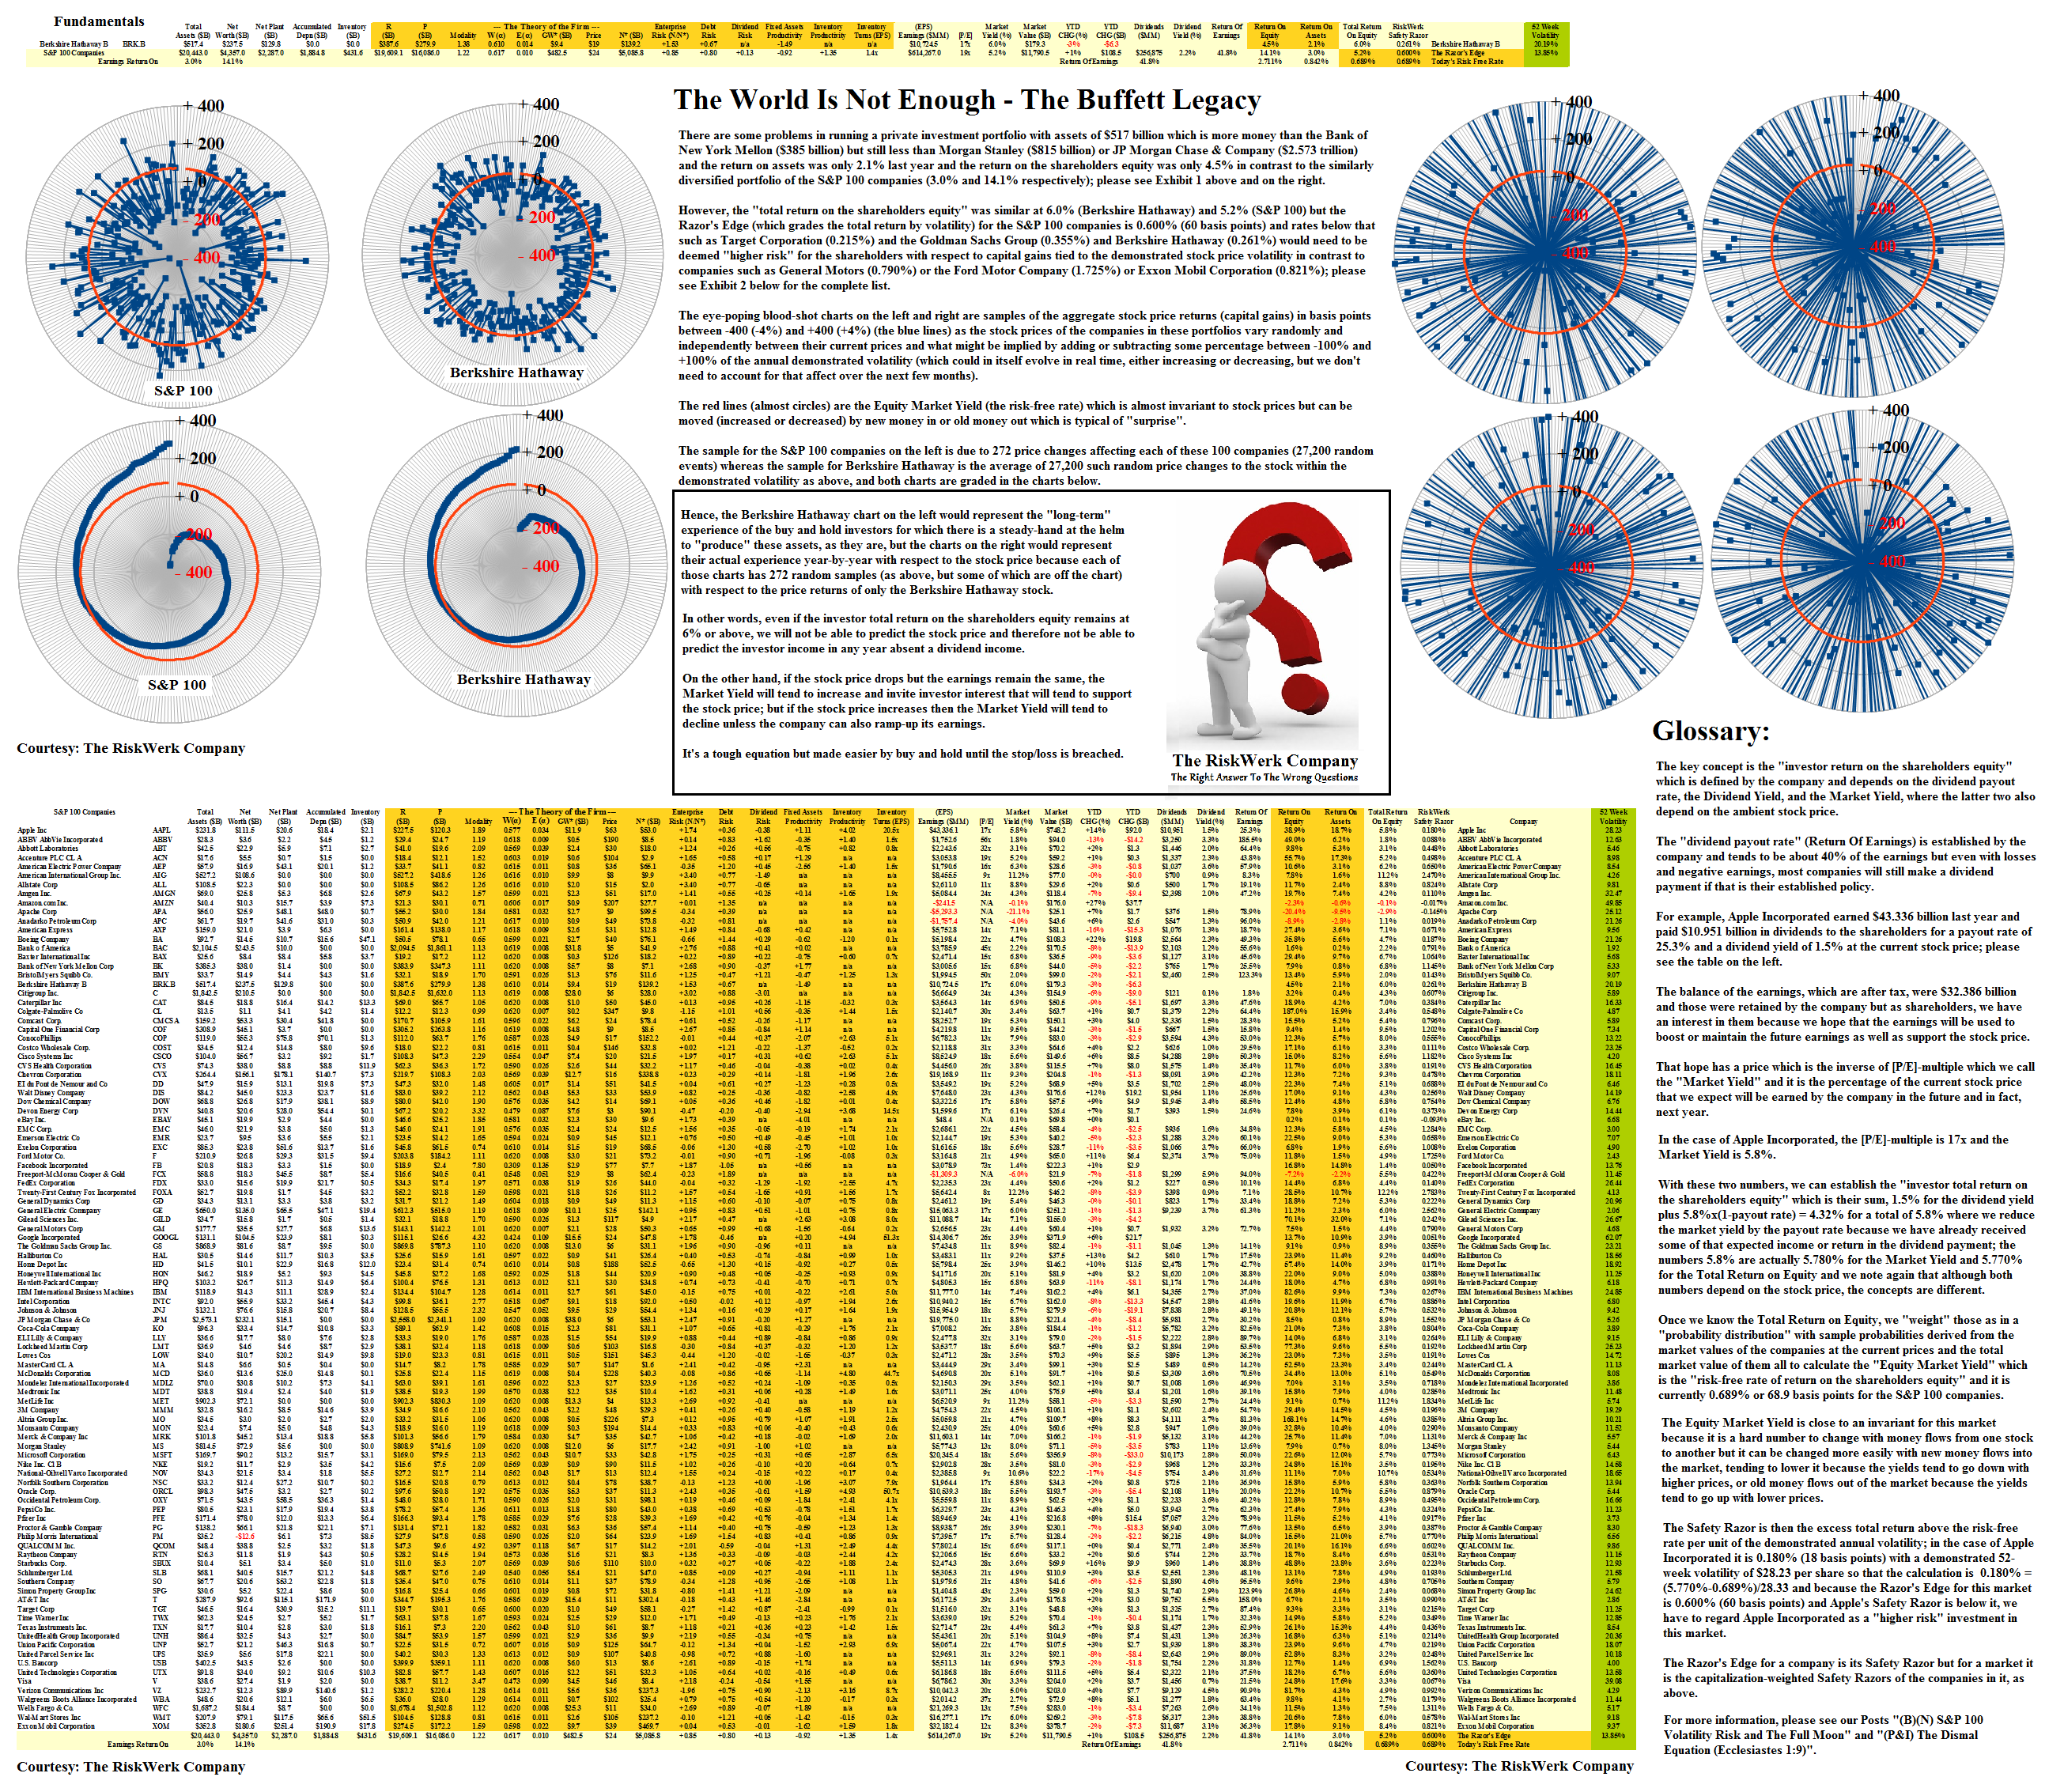
Figure 2.1: The RiskWerk Company Safety Razor
For more information on the Equity Market Yield and the terms that we have used above, please see our Posts “(P&I) The Dismal Equation (Ecclesiastes 9:1)” and “(B)(N) S&P 100 Volatility Risk and The Full Moon” and “(B)(N) NASDAQ 100 Volatility and The Stone Bunnies“.
And for more information on real “risk management” in modern times and additional references to the theory and how to read the charts and tables, please see our Post, The RiskWerk Company Glossary and “(P&I) Dividend Risk and Dividend Yield“, and our recent Posts “(P&I) The Profit Box” and “(P&I) The Process – In The Beginning“; and we’ve also profiled hundreds of companies in these Posts and the Search Box (upper right) might help you to find what you’re looking for, such as “(B)(N) TLM Talisman Energy Incorporated” or “(B)(N) ATHN AthenaHealth Incorporated” or “(B)(N) PETM PetSmart Incorporated“, to name just a few.
And for more applications of these concepts please see our Posts which rely on the Theory of the Firm developed by the author (Goetze 2006) which calibrates The Process to the units of the balance sheet and demonstrates the price of risk as the solution to a Nash Equilibrium between “risk-seeking” and “risk-averse” investors within the demonstrated societal norms of risk aversion and bargaining practice. And for more on The Process, please see our Posts The Food Chain and The Process End-Of-Process.
And for more on what risk averse investing has done for us this year, please see our recent Posts on “(P&I) The Easy (EC) Theory of the Capital Markets” or “(B)(N) The Easy (EC) Theory of the S&P 500“, and the past, The S&P TSX “Hangdog” Market or The Wall Street Put or specialty markets such as The Dow Transports & Utilities or (B)(N) The Woods Are Burning, or for the real class action, La Dolce Vita – Let’s Do Prada! and It’s For You, Dear on the smartphone business.
And for more stocks at high prices, The World’s Most Talked About Stocks or Earnings Don’t Matter – NASDAQ 100. And for more on what’s Working in America, Big Oil, Shopping in America or Banking in America, to name just a few.
Postscript
We are The RiskWerk Company and care not a jot for mutual funds, hedge funds, “alternative investments”, the “risk/reward equation” and every other unprovable artifact of investment lore. We have just one product
The Perpetual Bond™
Alpha-smart with 100% Capital Safety and 100% Liquidity
Guaranteed
With No Fees and No Loads on Capital
For more information on RiskWerk, please follow the Tags or Categories attached to this Letter or simply enter Search for additional references to any term that we have used. Related data may be obtained from us for free in a machine readable format by request to RiskWerk@gmail.com.
Disclaimer
Investing in the bond and stock markets has become a highly regulated and litigious industry but despite that, there remains only one effective rule and that is caveat emptor or “buyer beware”. Nothing that we say should be construed by any person as advice or a recommendation to buy, sell, hold or avoid the common stock or bonds of any public company at any time for any purpose. That is the law and we fully support and respect that law and regulation in every jurisdiction without exception and without qualification to the best of our knowledge and ability. We can only tell you what we do and why we do it or have done it and we know nothing at all about the future or the future of stock prices of any company nor why they are what they are now. The author retains all copyrights to his works in this blog and on this website. The Perpetual Bond®™ is a registered trademark and patented technology of The RiskWerk Company and RiskWerk Limited (“Company”) . The Canada Pension Bond®™ and The Medina Bond®™ are registered trademarks or trademarks of the Company as are the words and phrases “Alpha-smart”, “100% Capital Safety”, “100% Liquidity”, ”price of risk”, “risk price”, and the symbols “(B)”, “(N)” and N*.
