(B)(N) HPQ Hewlett-Packard Company

So let’s play ball!
Drama. Investors and their coaches, the analysts, show-up every year for Spring Training in their hockey gear and they’ve been doing it for years which is OK – let’s play ball – but we have to say a few things now and then just to be fair.
Getting to 1st base is not too hard using their “paddle” which they call a “schtick” but after that they need to know the difference between “like” and “likeable” as in “we like the earnings; we like the product; we like the management; and we love the price” and so forth because there is no reason that what they like should also be likeable (TheStreet, February 27, 2015, If You Liked Hewlett-Packard Stock at $40 You Should Love It at $34).
And these guys really stand-out on the field in their hockey gear and alma mater (and the crowd loves them, we think) but no matter how beautiful they are and “dressed to kill” as they are, we still have to tell them that the difference between “like” and “likeability” in investing is that we expect to get our money back when we want it – 100 % capital safety and 100% liquidity – and to obtain a hopeful but not necessarily guaranteed return above the rate of inflation.
That is, we want a non-negative real rate of return and if we don’t get it or some assurance thereof or they don’t get it, so to speak, we might just as well buy another hot-dog and pray for rain.
Exhibit 1: (B)(N) HPQ Hewlett-Packard Company – Risk Price Chart
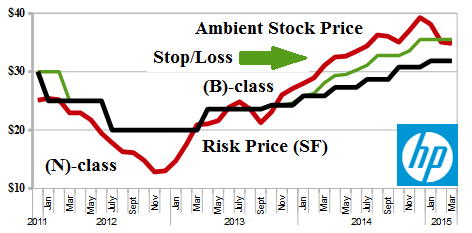
Figure 1.1: (B)(N) HPQ Hewlett-Packard Company – Risk Price Chart
The chart on the left is called the “Risk Price Chart” because the two most important lines on it are the ones that we have some insight into – the Risk Price (SF) and the Stop/Loss.
We don’t know anything about the stock price (the red line) except what it is and it could be anything for no reason at all (The Tao of Stock Prices (Goetze 2006)) but the Risk Price (SF) (black line) resolves a Nash Equilibrium between “risk seeking” and “risk averse” investors with the primary difference between them being the need for liquidity and therefore their willingness to buy and hold these stocks at those prices above the price of risk; the price of risk is also the “least stock price at which the company is likeable” and why we need to be careful of what we “like” to be sure that it’s also “likeable”.
For example, we never buy for holding a stock that is trading below the price of risk (as was Hewlett-Packard throughout most of 2012) because it is provably in the (N)-class and a zone of especial stock price volatility and investor uncertainty that makes it difficult to protect the price that we have with a cheap Stop/Loss (the green line).
For an investor, of course, the “price of risk” is always the price that they paid for the stock but whether it is “the” price of risk depends on whether that price can be reasonably well-defended; if not, then the price of risk is higher and they have a bought a stock that is trading in the (N)-class.
Moreover, the price of risk (Risk Price (SF) which is a calculation) tends to be non-decreasing as the balance sheets of the company “expand” but certain events such a loss of market share or a product failure or new competition can cause the price of risk to decline for a while as it did in the case of Hewlett-Packard and it might again as it’s considering dividing the company into two separate businesses with the old one focusing on consumer hardware (HPQ) and the new one Hewlett Packard Enterprise (HPE) competing with the “likes” of Cisco and IBM.
A Good Defense Is Half-Done
Nevertheless, we always need the Stop/Loss because investors might do anything and typically respond to their “likes”, “dislikes” and “anxiety” which we don’t share and there’s always the possibility of a “surprise”; our Stop/Loss is always set to the price of risk when the company is trading in the (N)-class and its price is therefore below the price of risk and the Stop/Loss, but the Stop/Loss also becomes non-decreasing once we buy the stock at or above its price of risk as we did in February last year at $28 and we were sold out of it again this week at $35 although it’s still trading above the price of risk at $31 (please see Exhibit 1 above).
All that means is that we’ve been “benched” and might have to sit out an inning or so to see what happens next (or until we get our mojo back) because we have no idea what the stock’s fans are going to do and we can best afford to wait until they show us.
But we also tell them that it’s important to remember that investing is a “team sport” and that we should look at the whole team to see what their prospects are and where else we might use our money while we’re waiting; please see Exhibit 2 below (and click on it to make it larger as required).
Exhibit 2: Big Cap – High Tech – Hooray – Risk Price Chart

Figure 2.1: Big Cap – High Tech – Hooray – Risk Price Chart
We noted that the “risk-free return” which we call the “Equity Market Yield” for this portfolio is 0.781% or 78.1 basis points with a demonstrated volatility of 15.78% which is about 13% above the Market Yield for all the S&P 100 companies (0.689% or 68.9 basis points) with a higher volatility (S&P 100 13.85%) which means that the high tech companies are currently systemically undervalued by about 13% and their prices and that rate might eventually be affected – and their prices raised – by their higher volatility and a relaxation of uncertainty because these stocks will appeal to investors with a higher risk tolerance.

So, you still want to play?
The Market Yield allows us to compare the equities markets with the bond markets and the only difference between them is the preference of investors and the amount of money which they have to invest; capital gains are just as likely or unlikely in one market as the other but the factors are different and those that affect the equities market are more diverse and foreseeable; the dividend rates currently tend to be higher than the bond rates which are keyed to new government bonds at 25 basis points; and the liquidity is higher and more transparent.
For more information on the Equity Market Yield, please see our Posts “(P&I) The Dismal Equation (Ecclesiastes 9:1)” and “(B)(N) S&P 100 Volatility Risk and The Full Moon” and “(B)(N) NASDAQ 100 Volatility and The Stone Bunnies“.
And for more information on real “risk management” in modern times and additional references to the theory and how to read the charts and tables, please see our Post, The RiskWerk Company Glossary and “(P&I) Dividend Risk and Dividend Yield“, and our recent Posts “(P&I) The Profit Box” and “(P&I) The Process – In The Beginning“; and we’ve also profiled hundreds of companies in these Posts and the Search Box (upper right) might help you to find what you’re looking for, such as “(B)(N) TLM Talisman Energy Incorporated” or “(B)(N) ATHN AthenaHealth Incorporated” or “(B)(N) PETM PetSmart Incorporated“, to name just a few.
And for more applications of these concepts please see our Posts which rely on the Theory of the Firm developed by the author (Goetze 2006) which calibrates The Process to the units of the balance sheet and demonstrates the price of risk as the solution to a Nash Equilibrium between “risk-seeking” and “risk-averse” investors within the demonstrated societal norms of risk aversion and bargaining practice. And for more on The Process, please see our Posts The Food Chain and The Process End-Of-Process.
And for more on what risk averse investing has done for us this year, please see our recent Posts on “(P&I) The Easy (EC) Theory of the Capital Markets” or “(B)(N) The Easy (EC) Theory of the S&P 500“, and the past, The S&P TSX “Hangdog” Market or The Wall Street Put or specialty markets such as The Dow Transports & Utilities or (B)(N) The Woods Are Burning, or for the real class action, La Dolce Vita – Let’s Do Prada! and It’s For You, Dear on the smartphone business.
And for more stocks at high prices, The World’s Most Talked About Stocks or Earnings Don’t Matter – NASDAQ 100. And for more on what’s Working in America, Big Oil, Shopping in America or Banking in America, to name just a few.
Postscript
We are The RiskWerk Company and care not a jot for mutual funds, hedge funds, “alternative investments”, the “risk/reward equation” and every other unprovable artifact of investment lore. We have just one product
The Perpetual Bond™
Alpha-smart with 100% Capital Safety and 100% Liquidity
Guaranteed
With No Fees and No Loads on Capital
For more information on RiskWerk, please follow the Tags or Categories attached to this Letter or simply enter Search for additional references to any term that we have used. Related data may be obtained from us for free in a machine readable format by request to RiskWerk@gmail.com.
Disclaimer
Investing in the bond and stock markets has become a highly regulated and litigious industry but despite that, there remains only one effective rule and that is caveat emptor or “buyer beware”. Nothing that we say should be construed by any person as advice or a recommendation to buy, sell, hold or avoid the common stock or bonds of any public company at any time for any purpose. That is the law and we fully support and respect that law and regulation in every jurisdiction without exception and without qualification to the best of our knowledge and ability. We can only tell you what we do and why we do it or have done it and we know nothing at all about the future or the future of stock prices of any company nor why they are what they are now. The author retains all copyrights to his works in this blog and on this website. The Perpetual Bond®™ is a registered trademark and patented technology of The RiskWerk Company and RiskWerk Limited (“Company”) . The Canada Pension Bond®™ and The Medina Bond®™ are registered trademarks or trademarks of the Company as are the words and phrases “Alpha-smart”, “100% Capital Safety”, “100% Liquidity”, ”price of risk”, “risk price”, and the symbols “(B)”, “(N)” and N*.
