(B)(N) Through The Looking-Glass
White Pawn to play and win in eleven moves.
Courtesy: Lewis Carroll, 1871.
Drama. We get a new forecast of the market every day, gratuitously, because we didn’t ask for one even if they call it “news”. Some say Up, some say Down, and the rest say nothing at all, but the only one that we like is the one that says, “We don’t know and it doesn’t matter anyway” which is our forecast.
Our forecast is not popular on Wall Street and it’s hard to imagine that the whole Street would just come out and say, “It doesn’t matter and why are you asking us anyway?”
But if they did – and they should – they could use their time more fruitfully in underwriting and brokerage activities and spend no time at all in counselling hapless “investors” who don’t know what their next move is going to be but will gamble their fortunes on rumors and free advice.

Less advice and more companies, please.
But Wall Street doesn’t know either and it doesn’t matter because what the market really needs is not more advice but more equities – more companies to buy and sell – because the market is starting to look very small at just $30 trillion or so and there’s a lot more money than that looking for investments – that is 100% capital safety, 100% liquidity, and a hopeful but not necessarily guaranteed return above the rate of inflation – for which “news” is no substitute.
For example, please see our recent Posts on “(P&I) The Tanaka Index” or the sorry state of “The Canadian “Hot” Money Stocks“, all of which markets have new money and are looking for new companies to buy because if they haven’t been bought yet, there’s slim chance that they’ll be bought later on their merits and the same old, same old, is not a good predictor of tomorrow (Bloomberg, August 27, 2014, Stocks Are Red Hot. Investors Are Cold Sober).

Figure 1: e-folding rate – Growth & Decay
And we need competent stocks, those that have a prospect and plan of earnings and are willing to return about 36.8% (please see below for the explanation) of those earnings to the shareholders as dividends.
There are, of course, lots of incompetent stocks that we might bet on, but it’s just a fact of life that when the real food chain runs-out and we’re just spending more and more money on the same equities, we have to die (please see Figure 1 on the right, and click on it for an illustration) and the Dow Jones Industrials are now trading above the “e-folding” rate (please see below) for both the Enterprise Risk and the Dividend Risk – which is good, but challenging, and we’ll explain that below.
More good news is that the plant and equipment are still underutilized and the inventory is moving at a gang-busters rate – which bodes well for the future – but the investors might never see that future if they are frightened of the present because of the past, for which forecasts of “stock prices” and feeble nostrums of investor behavior are of no help.

Courtesy: Business Insider
Moreover, “selling-off” or “taking profits” or even “re-balancing” is not a portfolio strategy because the money has to go somewhere, and if it’s idle and unemployed or underemployed, it’s just a loss, and we still have to pay the taxes on dividends and capital gains for those of us who have them; please see the illustration on the right for what thirty years of the S&P 500 has done for $100 after expenses.
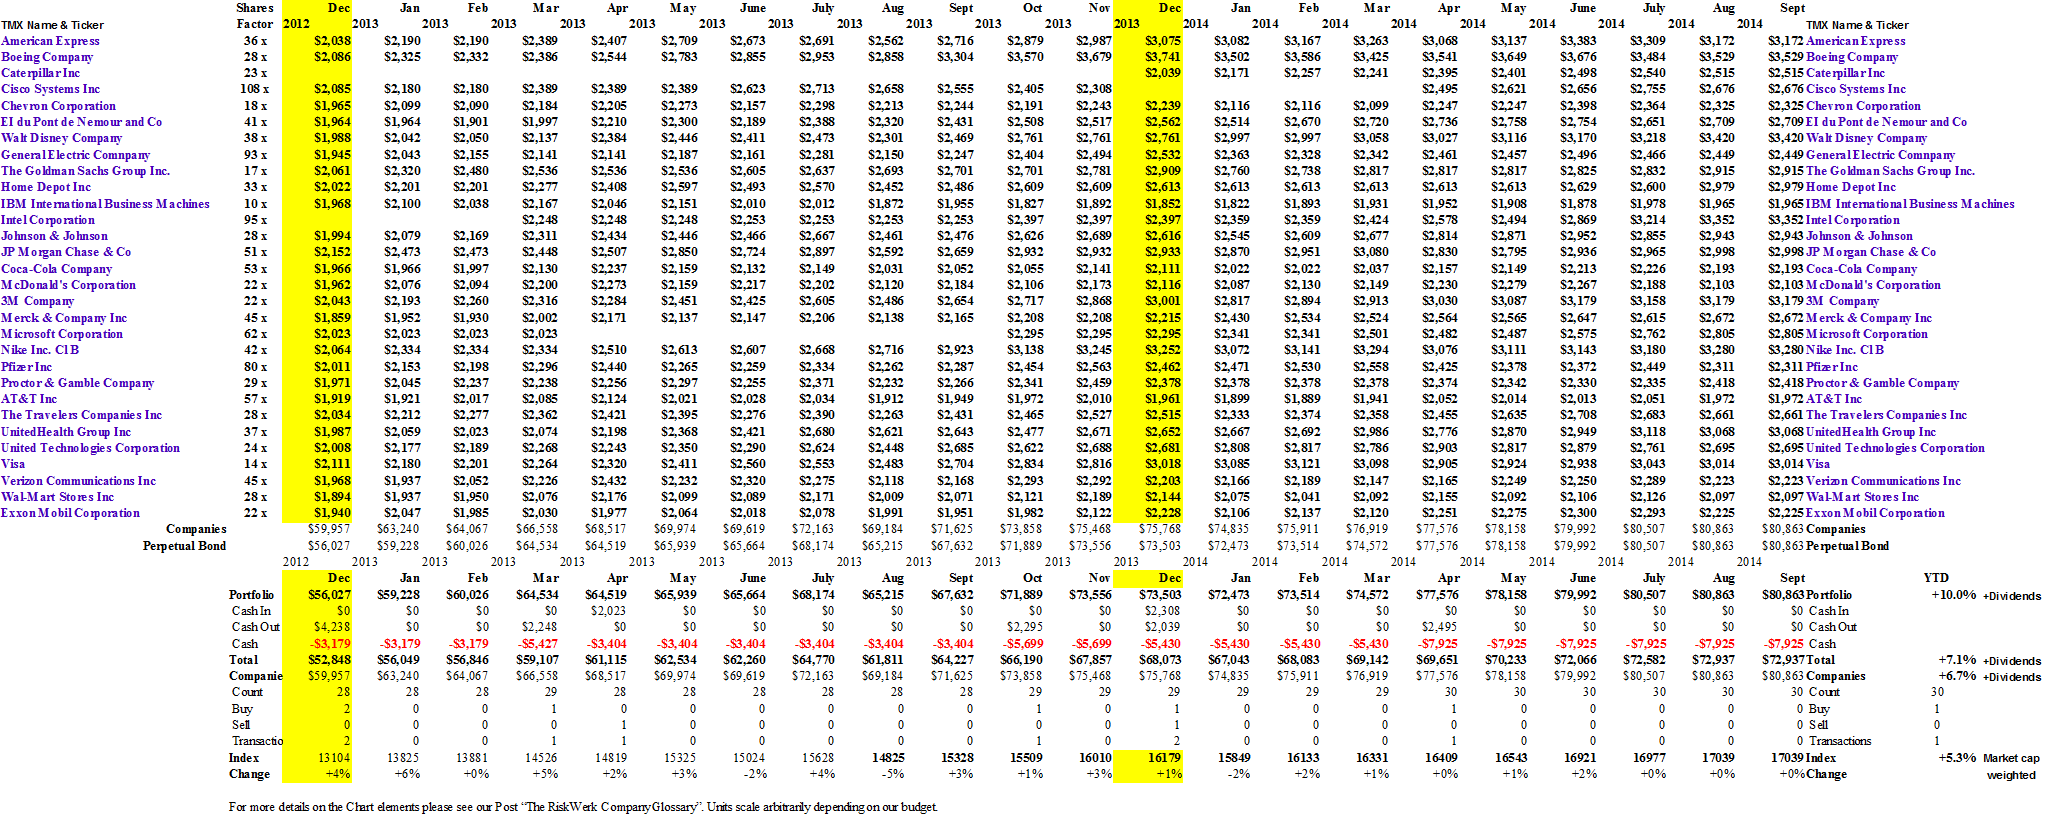
The Dow Jones Industrial Companies – September 2014

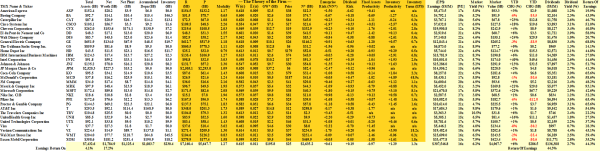
Figure 2: (B)(N) Dow Jones Industrials – Risk Price Chart
We’ve been riding most of the Dow Jones Industrial Companies for the last two years, and the portfolio, on an equal-weighted by value basis, was up +29% last year (and +30% on a modestly leveraged basis, using only the margin account) and it’s up another +7.1% (+10.0%) so far this year – and we don’t have any plans to “take profits” or “re-balance” because by setting the stop/loss appropriately, we can wait for the market to “give us profits” or not if the prices keep rising (OK); please Figure 2 above and click on the links (and again to make them larger if required) “(B)(N) Dow Jones Industrial Companies – Portfolio and Cash Flow Summary“.
These companies also returned 44.3% of their earnings to the shareholders last year, for a payout of $136 billion and a current aggregate dividend yield of 2.7%
Our complaint is that there’s “no action” in this market – it’s just buy and hold at or above the price of risk and wait to die – if we want more excitement, we need to go to the other big-cap markets, including the NASDAQ 100 – in that market we had to sell more companies than we bought (sell 19, buy 12, to hold 78) for +19.5% so far this year, if managed on the same basis as the Dow Industrials, above.

Is it time yet?
Nevertheless, while we’re waiting for this market to die, we can look at why it might die while we’re waiting because when it does die, we’re going to have a lot of idle and unemployed or underemployed cash to deal with; please see below for the Fundamentals.
Enterprise Risk & Dividend Risk
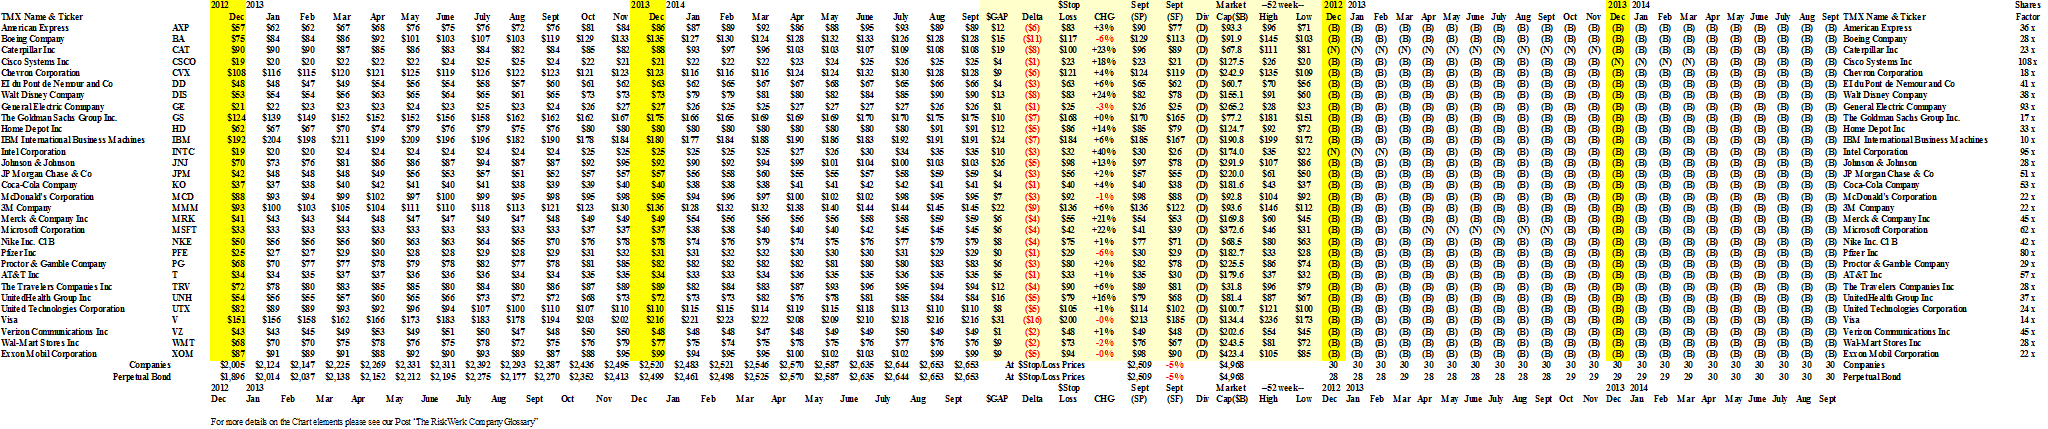
Exhibit 1: (B)(N) The Dow Jones Industrial Companies – Fundamentals
(B)(N) Dow Jones Industrials – Fundamentals
The e-folding rate is the mainstay of growth and decay in almost all of the sciences, and that includes actuarial science and “the miracle of compound interest” (a description attributed to Albert Einstein; please see our Post “(P&I) The Process – The 1st Real Dollar” for more background).
If we imagine that the net worth (N) of a company should (somehow) “grow” at a rate (k) in time that is proportional to its current value, then dN(t)/dt = k×N and the solution is N(t) = N×exp(k×t), which might be more familiar as N(t) = N×(1+i)^t where 1+i=exp(k) and i>0 if k>0 and i<0 if k<0; in particular, we see that N(t)=e×N if t=1/k so that in 1/k-units of time (years, typically, but it could be seconds in chemistry), N will increase by a factor of e=2.71828… the exponential and by the square of that amount in 2/k-units of time and so forth, signifying an “exponential growth” in linear time.
We can replace the “somehow” above by calculating the “Enterprise Risk” = 1 + log(N/N*), where N* is the projection of (N*) developed in the abstract Theory of the Firm and which is the result of “compounding” into the units of the balance sheet as N*= “Accumulated Depreciation” + GW*+ “Net Plant & Equipment” + “Inventory”, where each of those elements are the “factors of production” (and the accounting values are adequate in most cases) and GW* is the Coase Dividend which is the “balance sheet worth of the trading connections” and it is itself the result of “iterating” the “working capital” of the firm, (W), which is itself the result of “iterating” the “common capital” of the firm, (W)×(1-(W)), that results from the fact that the firm and its trading connections are “doing business” on “equitable terms” according to the societal standards of bargaining practice and risk aversion; please see the Theory of the Firm for more details.
However, “time” is lost in the translation and rather than thinking of (N) “becoming” (N*), it’s more effective to think of (N*) as “being” (N) in the “present tense”, so to speak, and the equation reduces to N = N*×(1/e)×exp(Enterprise Risk) and e×N=N*×exp(Enterprise Risk) or, even more cogently, that e×(N/N*) = exp(Enterprise Risk) and the e-folding rate of “conversion”, or realization, of N* into tangible N is the Enterprise Risk.

What time is it? We’re thinking about buying some stocks.
In particular, the “e-folding time” of N* to e×N as N*×(1+i)^t, as above, for unknown t and i, is positive if the Enterprise Risk >0 and negative if the Enterprise Risk <0 and, as a result, “when” becomes “is” and there is no need to “forecast” anything.
Nor do we need to know what “time” it is, if we’re wondering how these companies are doing; this is an important concept because we take-out the “time” and ignore “local volatility”, including its history, and substitute several “state measurements” – five of them which we’ll explain below – for which there is both provable theory and demonstrably competent practice.
It is, of course, still possible to forecast N* by capitalizing future balance sheets which are the result of the firm’s plans for growth, earnings, and dividends, and the elements are GW*, the accumulated depreciation and the net plant & equipment and the inventories, as above, but they have nothing to do with “forecasting” a future stock price which puts the “cart before the horse” and is backwards-looking and promotes volatility and uncertainty in the market.
Nevertheless, the analysis is useful in IPOs and for forecasting a future stock price in any case because the plausible future stock prices can be estimated from the imputed dividend yield, or even price to earnings [P/E]s, and the imputed market price for the Coase Dividend; for an example, please see our recent Post on “(B)(N) Fannie Mae & Freddie Mac“.
The Five Equations of State
The “factors of production” sum to N* = “Accumulated Depreciation” + GW*+ “Net Plant & Equipment” + “Inventory”, as above, of which the “tangibles” are its net plant & equipment and its inventory, and the Theory of the Firm requires (by proof) that we have to add them to get N*, which puts $1 of the Coase Dividend at the same level as $1 of the accumulated depreciation, where the latter is often dominated by tax considerations and normative depreciation rates.
Moreover, we can see from Exhibit 1 above that the Coase Dividend ($196 billion) is dwarfed by the sum of the other three factors ($2,439 billion), and even by the accumulated depreciation ($1,125 billion) with which it has more “likeness” than the other two factors (the net plant & equipment and the inventories) although that is not necessarily the case on a company-by-company basis.
Notwithstanding the importance of these distinctions, the differences are “worked-out” in the Theory of the Firm in a number of ways; for example, the accumulated depreciation is a charge to the net worth (N) and if is too high or too low, then both the net worth (N) and (N*) are affected accordingly but in opposite ways and the Coase Dividend depends on the modality, α=R/P, and it is proportional to R+P, so that it can re-stated as GW* = P×(1+α)×E(α) (please see Exhibit 1 above) which becomes important for the banks and financials for which “accumulated depreciation” tends to be insignificant but for which GW* becomes very significant.

Figure 1.1: Inventory & Fixed Assets Productivity
The two “productivity” measures are the earnings to the sum of the net fixed assets plus the accumulated depreciation (hence, the gross fixed assets) and the earnings to the inventory; please see Figure 1.1 on the right.
The chart is graded from low inventory risk (at Boeing and Caterpillar) to high inventory risk (at Microsoft, Verizon and McDonalds, for example) and the “risk” is to earnings; on the other hand, in so far as the earnings are maintained, high numbers also means “high productivity”.
In aggregate, we can say that the inventory for these companies has a “high productivity” and that the “fixed assets” have additional capacity; please see the chart for additional details.
But What About The Stock Prices?
This information, of course, doesn’t help us with stock prices because these companies don’t actually “make” stock prices – investors do that with their ideas and their money.
However, it’s not unreasonable to assume that what these companies did last year, and in 2012, they’ll also do this year (with respect to Figure 1.1) but that doesn’t explain why the Dow was trading at 13,000 in 2012 and is trading at 17,000 today or at what level it might trade at in the next few days or months.

Figure 1.2: Dividend Risk & Dividend Yield
Most investors don’t seem to understand the words “safe, liquid, and hopeful” until later because if they did, they wouldn’t be signing the contracts for several trillions of dollars worth of mutual funds and ETFs or be “worried” about today’s stock prices and tomorrow’s market but we can still start our inquiry with the current demonstrated relationship between the “dividend yield” and the “dividend risk”; please see Figure 1.2 on the left.
We don’t see any evidence of a “bubble” and the inference of the chart is straightforward – a “real bubble” would “implode” the orange line and a “real bear market” would “explode” it; please see the text in Figure 1.2 for more details.
It’s also noteworthy that a buoyant, or boom-economy, will tend to expand the blue line (the dividend risk) but that a “recession” will tend to contract it, and that the “action” is contra the dividend yield (orange line) in those same circumstances; hence, Figure 1.2 describes a “money pump” but the system can’t be “closed” without offending the 2nd law of thermodynamics and, therefore, Wall Street, we need more equities, not more advice on what to do with our money.
The last measure that might help us to understand where the market “is” is the Enterprise Risk = 1 + log(N/N*) and its relationship to the market price of the Coase Dividend which generates (N*) in the abstract Theory of the Firm and it is N* that supports the current value of the shareholders equity and that is a good starting point to increasing it.
The Coase Dividend, however, always measures the same thing – the “balance sheet worth of the trading connections” – but the trading connections of companies in different industries are quite different; for example, the trading connections of the banks, financial companies, and service companies, are dominated by their customers and their employees, but the trading connections of the industrials, and even retail companies, need to include their suppliers and “infrastructure” that supports their trade, for example, from which these types of companies derive a large benefit.
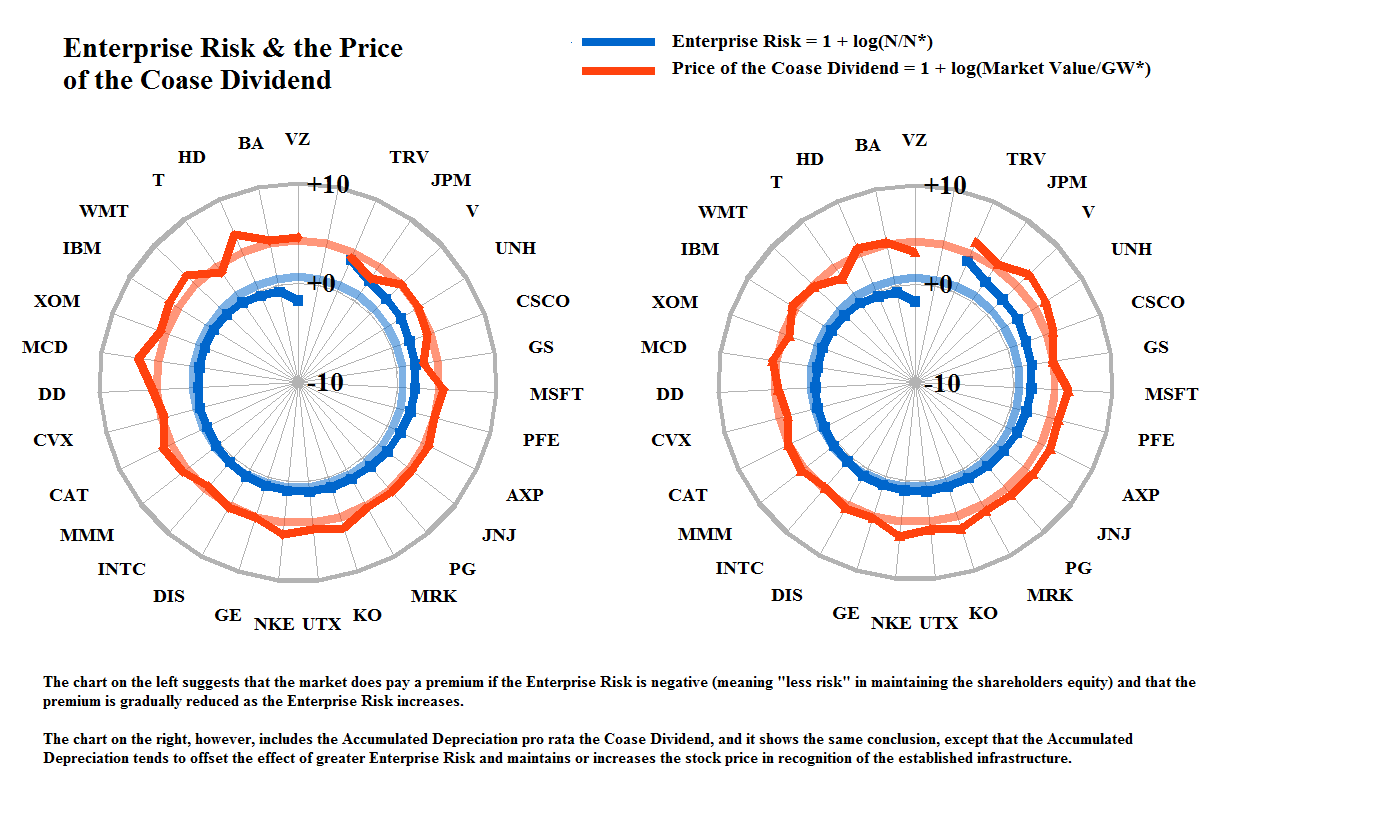
Figure 1.3: Enterprise Risk & the Coase Dividend
But we don’t measure “infrastructure” by what’s in-place (the net plant & equipment), but rather by “what part of it has been produced” and that is the accumulated depreciation, if reasonably rendered.
Hence, we can “offset” these differences – on balance – by “pricing” the accumulated depreciation pro rata with the Coase Dividend; please see Exhibit 1.3 on the left.

Right, maybe another time?
Unfortunately, based on our analysis, we don’t have any “news” and nothing to worry about, and we don’t think that “it’s time yet” but that’s not our call – it might become fashionable to think that these companies won’t produce last year’s earnings this year, but then, there’s always the year after and what we really need is more equities so that we don’t have to keep buying and selling the same things at higher prices.
For more information on real “risk management” and additional references to the theory and how to read the charts and tables, please see our Post, The RiskWerk Company Glossary and “(P&I) Dividend Risk and Dividend Yield“, and our recent Posts “(P&I) The Profit Box” and “(P&I) The Process – In The Beginning“; and we’ve also profiled hundreds of companies in these Posts and the Search Box (upper right) might help you to find what you’re looking for, such as “(B)(N) TLM Talisman Energy Incorporated” or “(B)(N) ATHN AthenaHealth Incorporated” or “(B)(N) PETM PetSmart Incorporated“, to name just a few.
And for more applications of these concepts please see our Posts which rely on the Theory of the Firm developed by the author (Goetze 2006) which calibrates The Process to the units of the balance sheet and demonstrates the price of risk as the solution to a Nash Equilibrium between “risk-seeking” and “risk-averse” investors within the demonstrated societal norms of risk aversion and bargaining practice. And for more on The Process, please see our Posts The Food Chain and The Process End-Of-Process.
And for more on what risk averse investing has done for us this year, please see our recent Posts on “(P&I) The Easy (EC) Theory of the Capital Markets” or “(B)(N) The Easy (EC) Theory of the S&P 500“, and the past, The S&P TSX “Hangdog” Market or The Wall Street Put or specialty markets such as The Dow Transports & Utilities or (B)(N) The Woods Are Burning, or for the real class action, La Dolce Vita – Let’s Do Prada! and It’s For You, Dear on the smartphone business.
And for more stocks at high prices, The World’s Most Talked About Stocks or Earnings Don’t Matter – NASDAQ 100. And for more on what’s Working in America, Big Oil, Shopping in America or Banking in America, to name just a few.
Postscript
We are The RiskWerk Company and care not a jot for mutual funds, hedge funds, “alternative investments”, the “risk/reward equation” and every other unprovable artifact of investment lore. We have just one product
The Perpetual Bond™
Alpha-smart with 100% Capital Safety and 100% Liquidity
Guaranteed
With No Fees and No Loads on Capital
For more information on RiskWerk, please follow the Tags or Categories attached to this Letter or simply enter Search for additional references to any term that we have used. Related data may be obtained from us for free in a machine readable format by request to RiskWerk@gmail.com.
Disclaimer
Investing in the bond and stock markets has become a highly regulated and litigious industry but despite that, there remains only one effective rule and that is caveat emptor or “buyer beware”. Nothing that we say should be construed by any person as advice or a recommendation to buy, sell, hold or avoid the common stock or bonds of any public company at any time for any purpose. That is the law and we fully support and respect that law and regulation in every jurisdiction without exception and without qualification to the best of our knowledge and ability. We can only tell you what we do and why we do it or have done it and we know nothing at all about the future or the future of stock prices of any company nor why they are what they are, now. The author retains all copyrights to his works in this blog and on this website. The Perpetual Bond®™ is a registered trademark and patented technology of The RiskWerk Company and RiskWerk Limited (“Company”) . The Canada Pension Bond®™ and The Medina Bond®™ are registered trademarks or trademarks of the Company as are the words and phrases “Alpha-smart”, “100% Capital Safety”, “100% Liquidity”, ”price of risk”, “risk price”, and the symbols “(B)”, “(N)” and N*.
