(P&I) The Tanaka Index

Figure 1: The Tanaka Index
Drama. Corporations and investors in Japan are working hard to end their dependence on the government dole, which has long been the mainstay of personal and corporate wealth, and is supported by an excess of investment in interest-paying government bonds, for which they pay the interest which they collect – through their taxes.
Government bonds are as good as cash – true – but not much better, and scheduled to get worse, and they are a drag on the economy that needs to grow and can’t expect to support its people by clipping coupons next door to China and South Korea, and the many other entrepreneurial nations of Southeast Asia (Bloomberg, August 26, 2014, How a Novice Quant Developed an Index for Changing Japan and Bloomberg, August 24, 2014, Japan Said to Plan Tax-Free Investing Program for Kids).

You can’t fool all of the people, all of the time … we would think.
Moreover, the same problem appears to be emerging in the US with the “old-timers” still in their 30’s (The Street, Young Americans Prefer Bank Investments, Not Stock Market).
And that’s understandable, and intuitive, because the “investment industry”, and the “investment professionals” in it, are most notable for propinquity and a systemic inability to protect the customer’s capital, and this generation is hardened to both.
But we must take note of the Japanese experience, and the European experience, that “money” is not forever, and “forever” might be a lot sooner than we think.
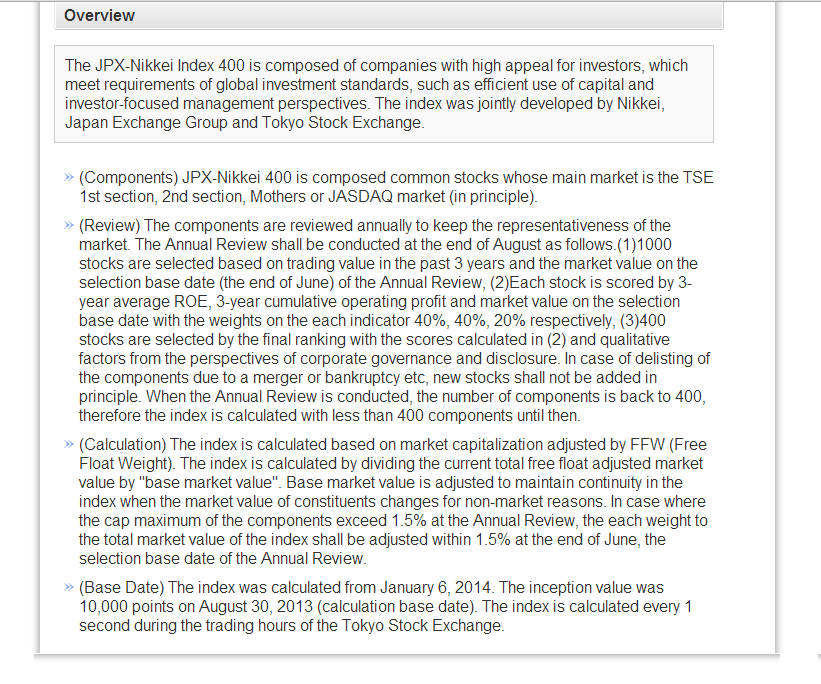
“The Tanaka Index” was developed by Mr. Daisuke Tanaka of the Japan Exchange Group Incorporated, with the support of the Japanese government and the Tokyo Stock Exchange (TSE), and it has been constructed to encourage “safe investing” in equities; please see Figure 1, above, and click on the link The Tanaka Index for more details.
The index (which trades as the JPX-Nikkei Index 400) is limited to 400 select companies, all considered Japanese, which are weighted by market capitalization in the index, but these companies are also graded by measures of “capital efficiency” – for which Mr. Tanaka uses the return on equity (40%), three years of cumulative operating profit (40%), and the market value (20%) – and those criteria have excluded about 1/3rd of the companies in the Nikkei 225 (NKY) and, recently, dropped the Sony Corporation which failed to make the cut (Bloomberg, July 29, 2014, Sony Seen Reject From Japan Shame Index in Losing Stock Cull).
How much “risk” should we have?
However, in our view, there is only one kind of “safe investing” – 100% capital safety, 100% liquidity, and a hopeful but not necessarily guaranteed return above the rate of inflation – for which “stock prices” are the “wild card”, and they can’t be correlated with any measure of “prudence”, because if they could, everybody would know it, and buy accordingly, and the measure would be attenuated and made ineffective by its own success; please see, for example, our Post on “(B)(N) Earnings Don’t Matter – NASDAQ 100” and, for what does matter, our recent Post on “(B)(N) The Canadian “Hot” Money Stocks“.
Moreover, the “fear of failing” is quite different from the “certainty of failing” if we don’t invest in the stock market because we have a “distaste” for it, and we can address the former with a little “practice”, and making a few bucks, and knowing how we did it, might improve the taste. Please see below.
The Return on Equity (ROE)
The “return on equity” is a nice measure because, if we have to be judgmental about a company’s prospects, we could begin by asking ourselves what we would have to do to get a return of 10% or 12% or 15% on our equity – is the “garage sale” going to be enough this year?
Exhibit 1: S&P 100 Return on Equity

Figure 1.1: S&P 100 ROE
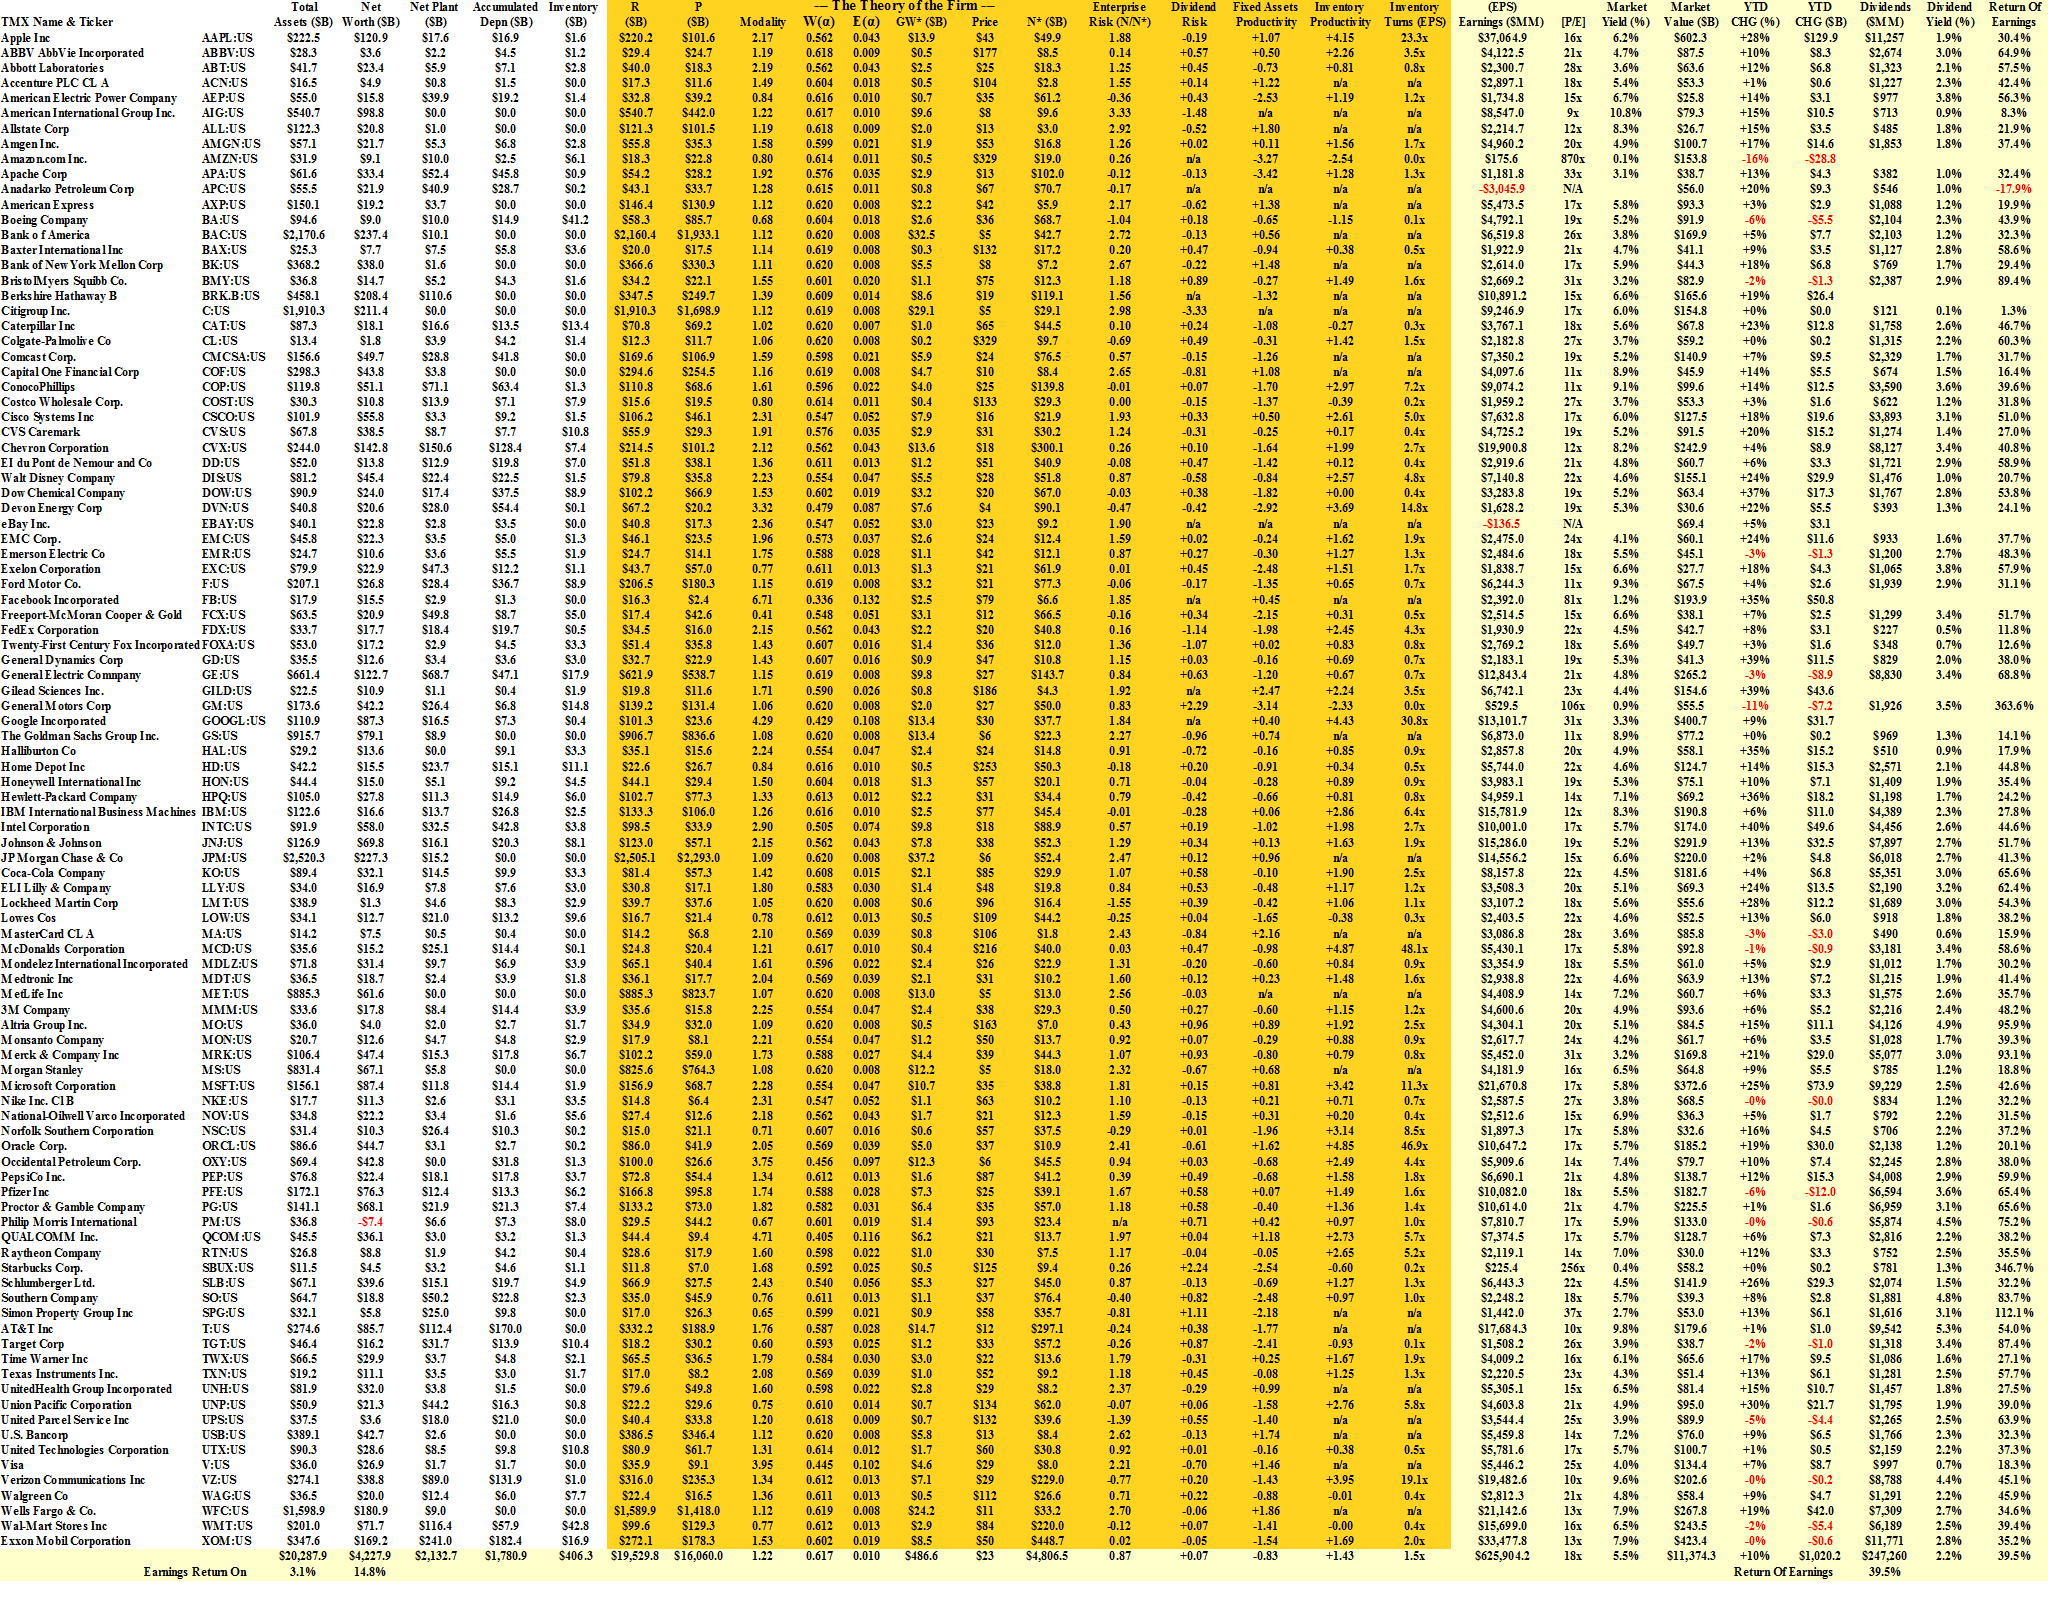
The chart on the left, Figure 1.1, shows the extraordinary variability of the return on equity in the S&P 100 companies; the average (excluding extreme returns) is 16.8%, and fifty of the companies did better than that, and another thirty companies returned between 10% and 17% on the shareholders equity.
But, should we drop Phillip Morris (-105%, $8 billion earnings, but negative, -$7.4 billion in the shareholders equity); or eBay, or Amazon, or Starbucks, or Berkshire Hathaway, all of which returned less than 5% on the shareholders equity?
And can we expect that Verizon, Boeing, and IBM, and several others, will increase their net worth by another 50% or more next year?
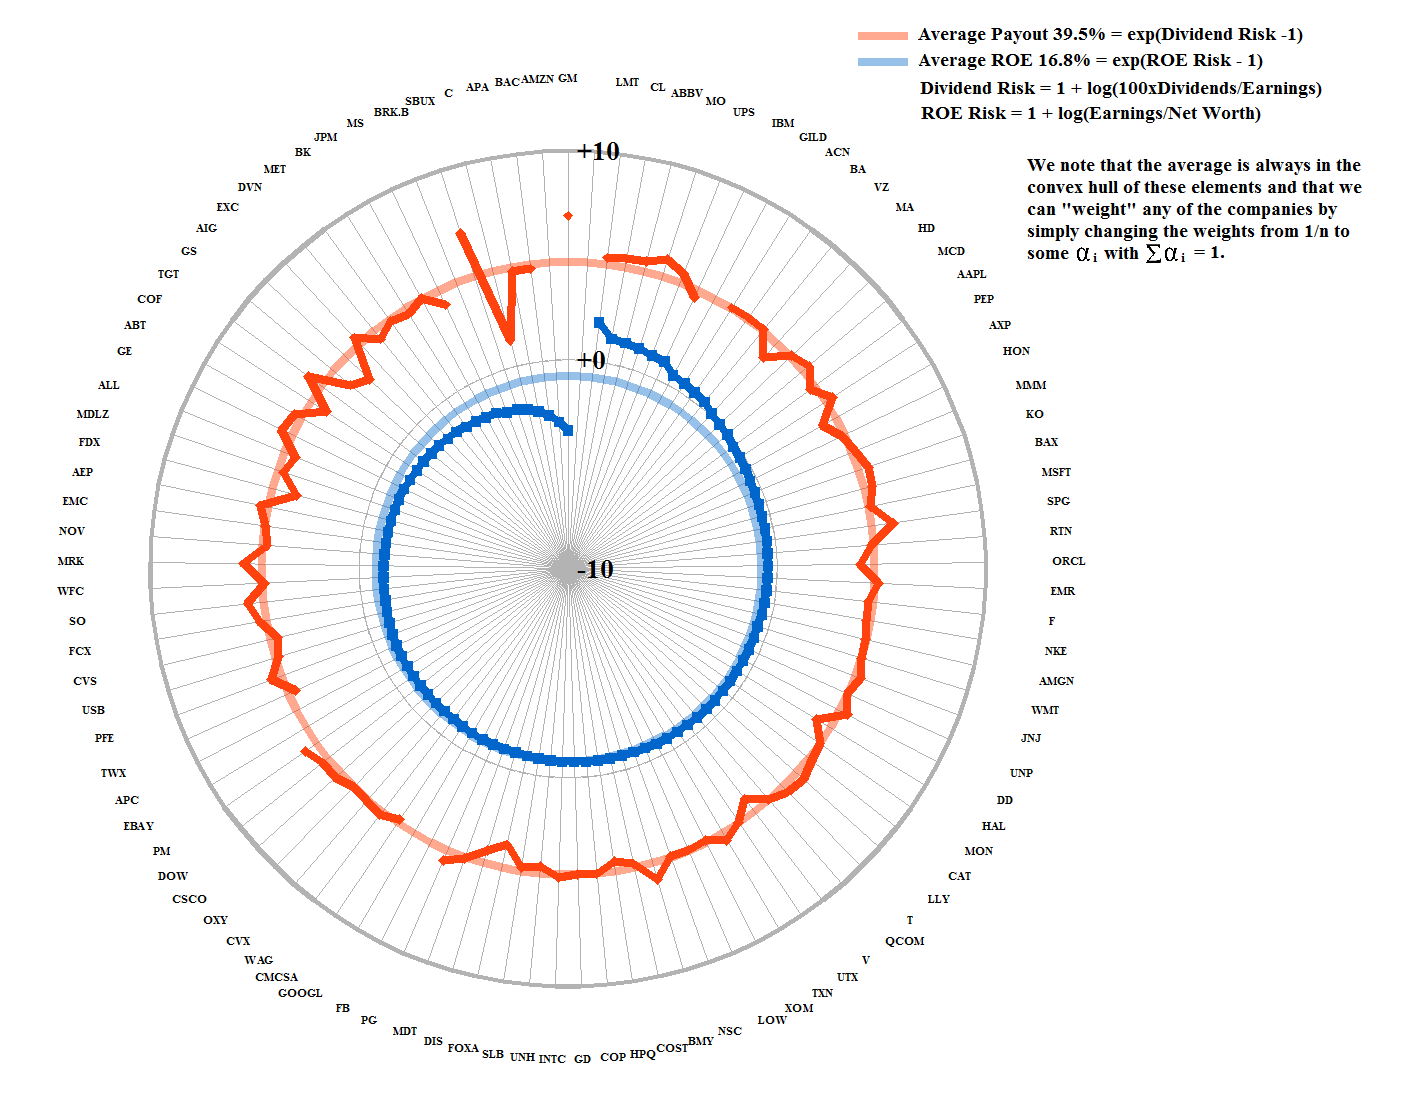
Figure 1.2: S&P 100 Dividend Payout vs ROE
And what does any of that mean for the stock price? Or the dividends?
In Figure 1.2, we have restated the ROE as Risk ROE=1+log(Earnings/Net Worth) (blue line) and “correlated” that with the Dividend Payout Risk =1+log(Dividends/Earnings) (orange line); the “faded” orange line is the average, 39.5%, return of earnings to the shareholders, and we can see that there is no exceptional reason for excluding very many, if any, of the companies.
The “gaps” belong to companies that don’t pay dividends, including Amazon, eBay and Berkshire Hathaway, for example, and the extreme points are General Motors (over 360% of its earnings) and Starbucks (340% of its earnings), for example, or Citigroup (only 1.3% of its earnings); please click on the link (and again to make it larger if required) “S&P 100 Fundamentals” for additional details.
The hardest thing to relate to anything is the stock price. But, in some sense, absent a liquidity requirement that would cause us to sell some stocks and, hopefully, take some profits if such a requirement for cash is not untimely, the stock price is irrelevant if we are satisfied with the dividend yield, at or above the rate of inflation.
The aggregate dividend yield is 2.2% (please see the Fundamentals) and these companies paid-out $247 billion in dividends from their aggregate earnings of $626 billion.
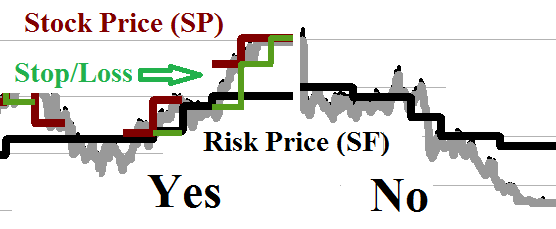
Although many investors think that their future is in capital gains, stock price gains are a “bonus” to investors who live by the triad – safe, liquid, and hopeful – and we know how to protect stock price gains with an attentive stop/loss policy, or sell-point, above the price of risk and, at the same time, limit our downside and risk to the capital (if there is any risk, to above the price of risk), because we never know when a stock price might suddenly collapse; for more examples, please see our Post “(B)(N) The Canadian “Hot” Money Stocks“.
Stock Prices Are Irrelevant
We might think that the dividend yield (which depends on the stock price and the payout rate) would correlate well with the payout rate, but we would be wrong; please see Figure 2.1 below. Or, how about the yield and the return on equity? Wrong again, please Figure 2.2 below. Or, how about the change in the stock price relative to the earnings (and therefore, the change in the net worth)? Nope, please see Figure 2.3.
Exhibit 2: Stock Prices Are Irrelevant
 Figure 2.1: S&P 100 Dividend Yield vs Payout Rate – No |
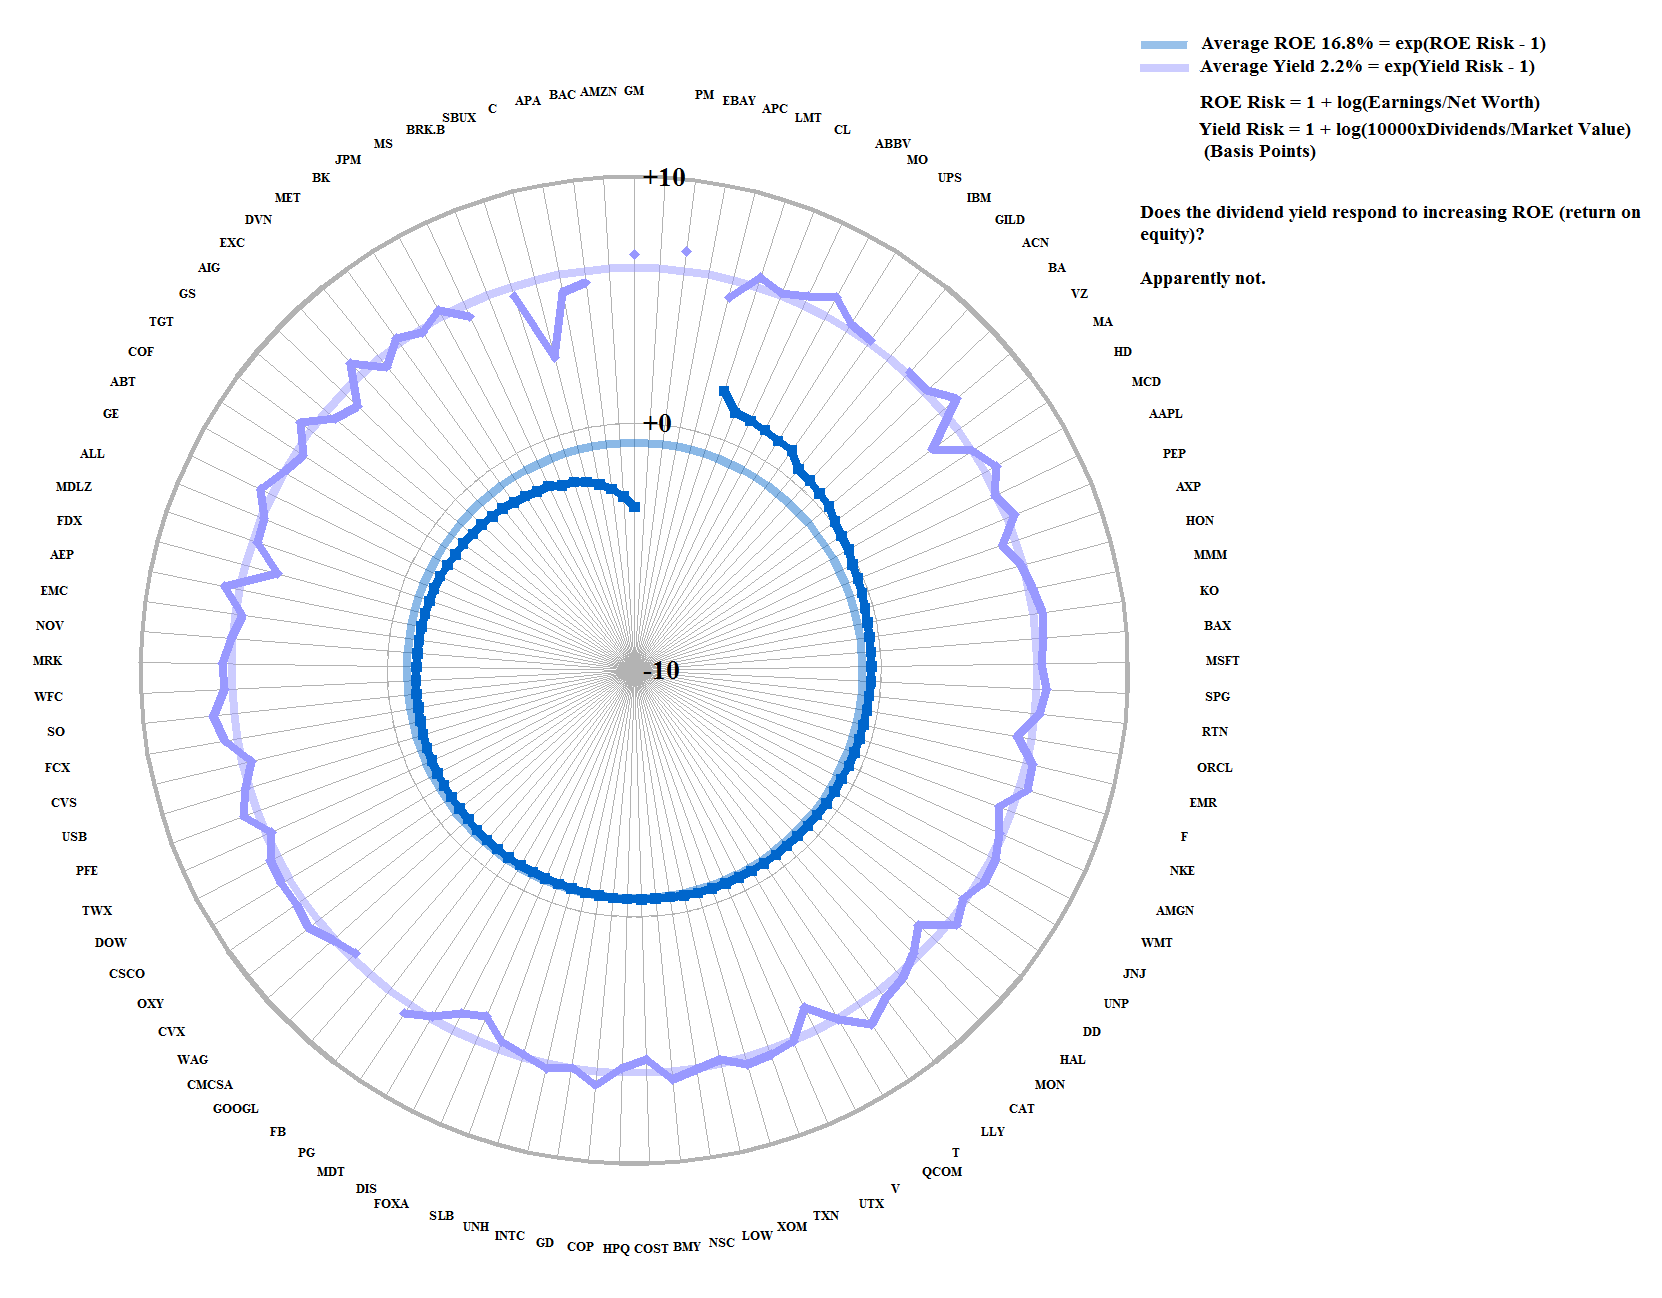 Figure 2.2: S&P 100 Dividend Yield vs ROE – No |
 Figure 2.3: S&P 100 Price to Earnings – No |

Falling Prices?
The primary issue of “stock prices” is not defense against rising prices, or buying at the bottom and maybe selling at the “top” and taking profits, but defense against falling prices, at any time, and always being in the market, because we never know what might happen next.
And for more information on real “risk management” and additional references to the theory and how to read the charts and tables, please see our Post, The RiskWerk Company Glossary and “(P&I) Dividend Risk and Dividend Yield“, and our recent Posts “(P&I) The Profit Box” and “(P&I) The Process – In The Beginning“; and we’ve also profiled hundreds of companies in these Posts and the Search Box (upper right) might help you to find what you’re looking for, such as “(B)(N) TLM Talisman Energy Incorporated” or “(B)(N) ATHN AthenaHealth Incorporated” or “(B)(N) PETM PetSmart Incorporated“, to name just a few.
And for more applications of these concepts please see our Posts which rely on the Theory of the Firm developed by the author (Goetze 2006) which calibrates The Process to the units of the balance sheet and demonstrates the price of risk as the solution to a Nash Equilibrium between “risk-seeking” and “risk-averse” investors within the demonstrated societal norms of risk aversion and bargaining practice. And for more on The Process, please see our Posts The Food Chain and The Process End-Of-Process.
And for more on what risk averse investing has done for us this year, please see our recent Posts on “(P&I) The Easy (EC) Theory of the Capital Markets” or “(B)(N) The Easy (EC) Theory of the S&P 500“, and the past, The S&P TSX “Hangdog” Market or The Wall Street Put or specialty markets such as The Dow Transports & Utilities or (B)(N) The Woods Are Burning, or for the real class action, La Dolce Vita – Let’s Do Prada! and It’s For You, Dear on the smartphone business.
And for more stocks at high prices, The World’s Most Talked About Stocks or Earnings Don’t Matter – NASDAQ 100. And for more on what’s Working in America, Big Oil, Shopping in America or Banking in America, to name just a few.
Postscript
We are The RiskWerk Company and care not a jot for mutual funds, hedge funds, “alternative investments”, the “risk/reward equation” and every other unprovable artifact of investment lore. We have just one product
The Perpetual Bond™
Alpha-smart with 100% Capital Safety and 100% Liquidity
Guaranteed
With No Fees and No Loads on Capital
For more information on RiskWerk, please follow the Tags or Categories attached to this Letter or simply enter Search for additional references to any term that we have used. Related data may be obtained from us for free in a machine readable format by request to RiskWerk@gmail.com.
Disclaimer
Investing in the bond and stock markets has become a highly regulated and litigious industry but despite that, there remains only one effective rule and that is caveat emptor or “buyer beware”. Nothing that we say should be construed by any person as advice or a recommendation to buy, sell, hold or avoid the common stock or bonds of any public company at any time for any purpose. That is the law and we fully support and respect that law and regulation in every jurisdiction without exception and without qualification to the best of our knowledge and ability. We can only tell you what we do and why we do it or have done it and we know nothing at all about the future or the future of stock prices of any company nor why they are what they are, now. The author retains all copyrights to his works in this blog and on this website. The Perpetual Bond®™ is a registered trademark and patented technology of The RiskWerk Company and RiskWerk Limited (“Company”) . The Canada Pension Bond®™ and The Medina Bond®™ are registered trademarks or trademarks of the Company as are the words and phrases “Alpha-smart”, “100% Capital Safety”, “100% Liquidity”, ”price of risk”, “risk price”, and the symbols “(B)”, “(N)” and N*.
