(P&I) The Federal Funds Rate
Why, Thank You.
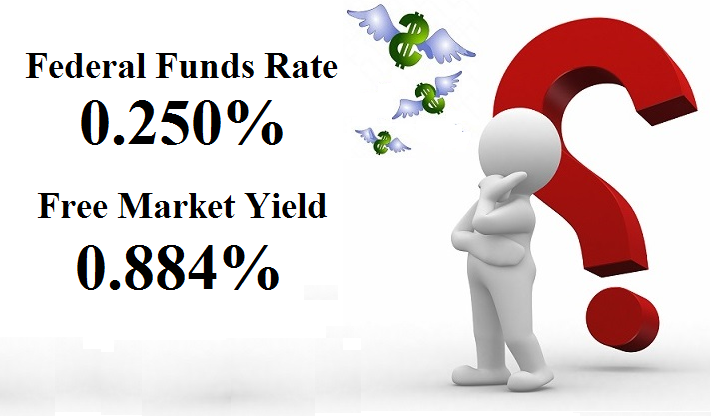
Drama. The market has taken an enormous interest in the “Federal Funds Rate” for the last several years – predicting, hoping, that it will rise soon – but it seems to know nothing of the rates that it demonstrates every day at which the investors are “lending money to each other” on the same basis – that is, it is “risk-free” at the rate of the “Free Market Yield” which is currently 0.884% (88.4 basis points) in the Dow Jones Industrial Companies and more than 3× the fixed Federal Funds Rate of 0.25% and 25 basis points.
Moreover, the Free Market Yield is set by the market on the same principle as the “Federal Funds Rate” in the US which is set daily by an auction among the banks themselves as the “overnight rate” to balance their regulatory capital and which has in recent years been backed by the US central bank at 25 basis points (0.25%, a very low rate for “infinite” funds) in order to assure adequate liquidity for bank lending and new enterprise if the banks’ funds and the savings rate of their customers are not sufficient to do it.
But the “markets” are the same (they are an auction and “equities” are just a form of “money”) and whether the “liquidity” is “infinite” or not and at what price depends on the investor interest in those markets and their willingness to buy and hold those stocks as an alternative to “money” at those prices.
For example, the Free Market Yield of the Dow Jones Industrial Companies is currently 0.884% (88.4 basis points, as above) which is nothing like the dividend yields (2.65%) or the returns on our capital in the past year (+8.7% last year and +1.23% so far this year) which are determined by the earnings of the companies themselves and our willingness to buy and hold their stocks at those prices.
But the difference in those returns and the Free Market Yield for this market is between “at risk” returns (dividends and capital gains or losses that are not predictable) and “no risk” returns which are predictable – there is no risk and we’re going to get our money back plus 88 basis points in one year – which is another kind of risk because the investors don’t want just 88 basis points for their work – but that’s also a different problem; please see, for example, our recent Post for what it does to our volatility-bound pension funds “(P&I) The World’s Worst Pension Plan”.
On balance, buyers would like the Free Market Yield (and the Federal Funds Rate) to be higher because stock prices will tend to be lower whereas sellers would like it to be lower because the stock prices for the stocks that they own will tend to be higher.
Figure 1: Dow Jones Industrials – The Free Market Yield and the price of “risk-free”.
However, the current Free Market Yield has “cleared” the market at 88.4 basis points and we know its price and its price is high but everything that might support that price is down or flat and has been for all of this year to date; please see the illustration on the right (and click on it and again to make it larger as required).
What that means is not predictable because large amounts of money entering or leaving the market can change that equation – if the investors sell-off and the stock prices decline (for the same assets), the Free Market Yield will rise to a higher level, perhaps similar to that of 2011 at 1.151% or 115.1 basis points; on the other hand, what else are they going to do with their money?
The Free Market Ecology & the Free Market Yield
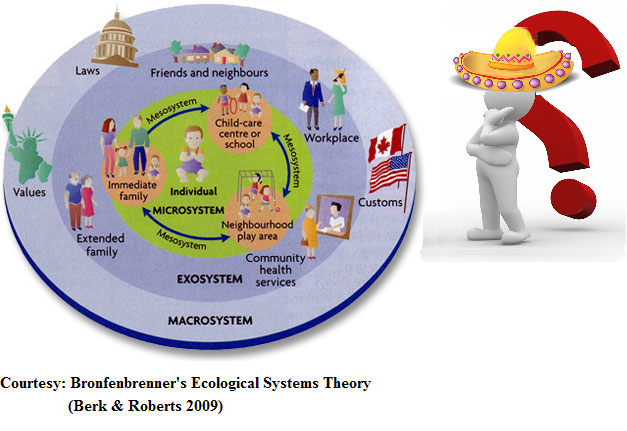
Figure 2: Bronfenbrenner’s Ecological Systems Theory (Berk & Roberts 2009)
A “market” is an ecology very much as the wetlands or the desert or the mountains are “ecologies” with different inhabitants (investors), needs, and relationships defined by their personalities and their money both within that ecology and without (“externalities” or “macro-factors”).
Moreover, the major markets such as the NYSE or the S&P 100 or the NASDAQ are not the only markets in the World and there are also many markets within markets because a portfolio of stocks is itself a “market” and it demonstrates an ecology with certain risk factors and even one stock such as Apple Incorporated or IBM (in the alternative) is a “market” because of the specialized interests and motivations of the investors in those stocks as opposed to others in pharmaceuticals or energy or coal, for example.
In any such economy (and ecology or market), the “Free Market Yield” is the “force of interest” in the sense that if -∞ < δ(P) < +∞ is the Free Market Yield for that market, then exp(δ(P)×t) is the “expected risk-free return” on the capital and its earnings in t-years and in this case the “earnings” are the dividends and capital gains or losses.
The “e-folding rate” is 1/δ(P) and it is the time in years in which we might expect to triple (e=2.71828…) our money in this market (without “risk”) or more prosaically, we would expect to obtain a +200% return in 1/δ(P)-years by buying and holding these stocks and a more likely +100% return in ½×1/δ(P)-years, although we note that δ(P) is negative (δ(P) < 0) in economies that have a “depression” and it could also be a very large number in economies that have “inflation” or “hyper-inflation” and we need to think about what it means to make money “risk-free” in investments in those economies (in a “depression” or in a run-away inflation) as well as in a “normal economy” in which 0 < δ(P) < 1.
For example, the Free Market Yield of the Dow Jones Industrial Companies is currently δ(P) = 0.884% (88.4 basis points) and the e-folding time for this market is 113 years but our investment time horizons are much shorter although we might expect a +50% return on our money by the time that we’re ready to retire in thirty years by just buying and holding the stocks of the Dow Jones Industrial Companies but the issue is – is it a real return and does it account for inflation?
And the answer is, yes, it does because the benchmark for its value is the prices (in ambient dollars) that we’re willing to pay for an income and, therefore, the prices that we (or the market) are willing to pay at any time for the assets that actually support the purchasing power of our money (absent the delusions of governments which think they do).
The Free Market Yield
The Free Market Yield is the market capitalization weighted “Total Return on the Shareholders Equity” adjusted for volatility risk; moreover, it’s not just a matter of “weights” because in most markets of investment size, the distribution of market values for the equities in the portfolio will tend to be uniformly distributed between the minimum and maximum values over a reasonable time interval such as one year although we also expect (and account for) that there could be “accumulations” around some new “location” within that range as the stock prices tend to decrease or increase either for the equities in the portfolio relative to each other or the market that contains them as a whole.
 For more information and examples on the Free Market Yield and the terms that we have used above, please see our Posts “(P&I) The Dismal Equation (Ecclesiastes 9:1)” and “(B)(N) S&P 100 Volatility Risk and The Full Moon” and “(B)(N) NASDAQ 100 Volatility and The Stone Bunnies“ and for an introduction to The Barometer “(B)(N) What’s A Girl To Do” or “(P&I) The Swiss Franc Debacle“.
And for more information on real “risk management” in modern times and additional references to the theory and how to read the charts and tables, please see our Post, The RiskWerk Company Glossary and “(P&I) Dividend Risk and Dividend Yield“, and our recent Posts “(P&I) The Profit Box” and “(P&I) The Process – In The Beginning“; and we’ve also profiled hundreds of companies in these Posts and the Search Box (upper right) might help you to find what you’re looking for, such as “(B)(N) TLM Talisman Energy Incorporated” or “(B)(N) ATHN AthenaHealth Incorporated” or “(B)(N) PETM PetSmart Incorporated“, to name just a few.
And for more applications of these concepts please see our Posts which rely on the Theory of the Firm developed by the author (Goetze 2006) which calibrates The Process to the units of the balance sheet and demonstrates the price of risk as the solution to a Nash Equilibrium between “risk-seeking” and “risk-averse” investors within the demonstrated societal norms of risk aversion and bargaining practice. And for more on The Process, please see our Posts The Food Chain and The Process End-Of-Process.
And for more on what risk averse investing has done for us this year, please see our recent Posts on “(P&I) The Easy (EC) Theory of the Capital Markets” or “(B)(N) The Easy (EC) Theory of the S&P 500“, and the past, The S&P TSX “Hangdog” Market or The Wall Street Put or specialty markets such as The Dow Transports & Utilities or (B)(N) The Woods Are Burning, or for the real class action, La Dolce Vita – Let’s Do Prada! and It’s For You, Dear on the smartphone business.
And for more stocks at high prices, The World’s Most Talked About Stocks or Earnings Don’t Matter – NASDAQ 100. And for more on what’s Working in America, Big Oil, Shopping in America or Banking in America, to name just a few.
Postscript
We are The RiskWerk Company and care not a jot for mutual funds, hedge funds, “alternative investments”, the “risk/reward equation” and every other unprovable artifact of investment lore. We have just one product
The Perpetual Bond™
Alpha-smart with 100% Capital Safety and 100% Liquidity
Guaranteed
With No Fees and No Loads on Capital
For more information on RiskWerk, please follow the Tags or Categories attached to this Letter or simply enter Search for additional references to any term that we have used. Related data may be obtained from us for free in a machine readable format by request to RiskWerk@gmail.com.
Disclaimer
Investing in the bond and stock markets has become a highly regulated and litigious industry but despite that, there remains only one effective rule and that is caveat emptor or “buyer beware”. Nothing that we say should be construed by any person as advice or a recommendation to buy, sell, hold or avoid the common stock or bonds of any public company at any time for any purpose. That is the law and we fully support and respect that law and regulation in every jurisdiction without exception and without qualification to the best of our knowledge and ability. We can only tell you what we do and why we do it or have done it and we know nothing at all about the future or the future of stock prices of any company nor why they are what they are now. The author retains all copyrights to his works in this blog and on this website. The Perpetual Bond®™ is a registered trademark and patented technology of The RiskWerk Company and RiskWerk Limited (“Company”) . The Canada Pension Bond®™ and The Medina Bond®™ are registered trademarks or trademarks of the Company as are the words and phrases “Alpha-smart”, “100% Capital Safety”, “100% Liquidity”, ”price of risk”, “risk price”, and the symbols “(B)”, “(N)” and N*.
