(B)(N) S&P TSX Rents (Canadian REITS)

Courtesy: Rent, The Musical
Drama. Canadian REITS (Real Estate Investment Trusts) are amazing – they are not taxed if they distribute their net taxable income to their shareholders; they are all technically trusts, and some of them operate as mutual fund trusts, and they’re all in the business of “rent”.
As a result, they are all highly leveraged and tightly wound – debt is the name of their game and it’s always a challenge to turn money into income net of its costs.
Their return on equity (ROE) is a fair 10%, and their return on assets is a more modest 4.6%, but still above the long-term interest rates, and they paid $2.4 billion to their shareholders last year for an aggregate dividend yield of 5.5%, and they have a current market value of $43.4 billion which is just a tad over their net worth of $41.3 billion, and suggests a lot of caution among the investors; for example, the multiple is currently $18.5 trillion over $6.8 trillion in the S&P 500 companies (2.7×) for a return on equity of 13.9% and a return on assets of 3.1%, and an aggregate dividend yield of 2.0%.
In our pursuit of the eternal life annuity (please see our POST “(B)(N) More Money, Please (REITS)“, we had to turn this page and their annual reports read like an endless catalog of rental listings, acquisitions and dispositions of apartment and retail properties, occupancy rates, delinquencies, and “extra income” from service fees of all sorts – it’s a hard-scrabble business called “rents”, and at the end of the pipe, there dribbles out some small change for the investors – a 58.5% return of the earnings, to be exact, and a 5.5% dividend yield; please see Exhibit 1 below for further details.
But it’s a business that doesn’t require a lot of “heavy lifting”, or ingenuity, just a lot of attention to a lot of detail that could be revealed at the kitchen table on both sides of the business, and somebody’s got to do it; these investments create liquidity in an otherwise narrow market, and bring professional management to the otherwise “personal” business of the landlords.
 And, on balance, the mendacious leverage of these companies compared to their American counterparts in the same business for 10× the customers, is paid for with high rents and weak services that could be still higher, and still weaker, without them and the liquidity that they bring to the table; that’s pretty incendiary, but please see below, nor does it necessarily discourage what they are as investments.
Exhibit 1: S&P TSX Rents – Fundamentals
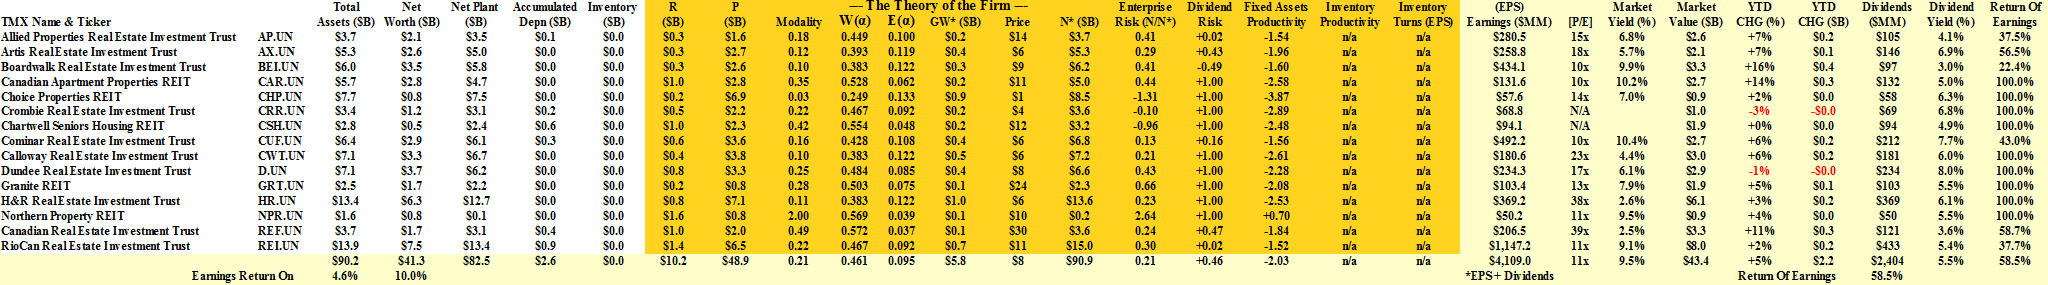
S&P TSX Rents – Fundamentals

Figure 1.1: (B)(N) S&P TSX Rents – Risk Price Chart
As an equities portfolio, there’s a problem with it – it’s volatile whereas the properties aren’t – but if we multiply the numbers by ten, it looks just like the American REITS; please see Figure 1.1 and 1.2 on the left.
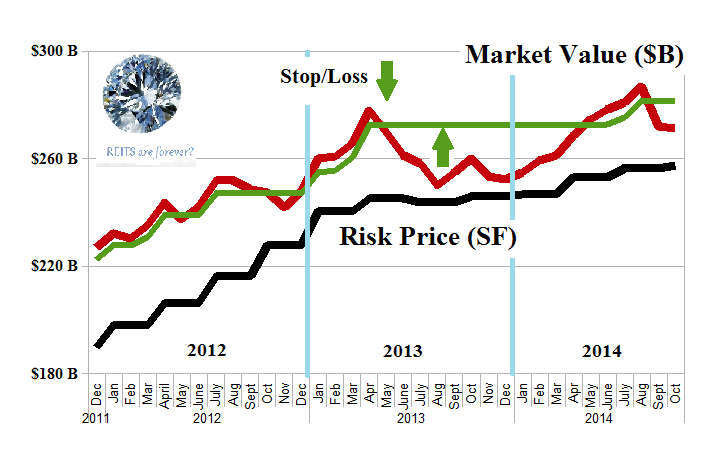
Figure 1.2: (B)(N) S&P NYSE REIT World – Risk Price Chart
But these companies are not anything like the American REITS because of the astonishing debt-leverage; please see below for further information.
Absent the stop/loss, we’d be out-of-pocket minus (8%) last year, but with the stop/loss we were into cash and had buying opportunities at lower prices because all of these companies (except Choice Properties REIT which is the Loblaw’s IPO last year) are trading above the price of risk; please click on the links (and again to make them larger if required) “(B)(N) S&P TSX Rents – Prices & Portfolio and Cash Flow Summary” for further details.
Shopping at low prices does marvelous things for our permanent yield, but we’re also concerned about our income, and we want to know how productive is the use of debt in harvesting profits from rents.
Corporate Debt and Equity for Shareholders
The headline is somewhat controversial because the Miller-Modigliani “Theorem” suggests (but doesn’t prove) that “dividend policy doesn’t matter”, but most businessmen say that it does, and that companies (and governments too) need to fund their growth with debt rather than the shareholders equity and, therefore, they ought to pay and maintain dividends.

Figure 1: Dividend Risk
Moreover, businesses themselves demonstrate that the normative rate for the payout of dividends from earnings is similar to 36.8% which is the e-folding rate for growth in the earnings, and the rate at which the Dividend Risk=0; for example, the demonstrated rate in the S&P 500 companies is 38.7%, and in the Dow Jones Industrials, 44.8%, but there are also variations that depend on the type of industry; please see Figure 1 on the right and for more information, our Post “(P&I) Dividend Risk & Dividend Yield“.
The “Enterprise Risk” is the uptake rate of the “factors of production” (N*) into the shareholders equity (N) and, therefore, into the earnings, and we define it as Enterprise Risk = 1 + log(N/N*); the factors of production are determined by Theory of the Firm which requires (with proof) that N* = GW* + “Fixed Assets (at cost)” + “Inventory”, where the latter are similar to their accounting meanings, and GW* is the “balance sheet worth of the trading connections” which we call the Coase Dividend.
The Coase Dividend, GW*, is calculated in the Theory of the Firm and its value is GW* = (R+P)×E(α) = P×(1+α)×E(α), where α=R/P is the modality, and R is “what is owed to the firm”, and P are its total liabilities and “what the firm owes”; please see Exhibit 1 above for examples and the Theory of the Firm for the derivations.
Therefore, if the firm “grows” and maintains its modality, α=R/P, which is typical, then GW* increases linearly with debt (P), as does N*’, and that’s equivalent to more fixed assets, or more inventory, funded by debt or equity, and which are at least as hard to obtain as more “customers”, for example; the “Debt Risk”, then, depends on the inverse of the modality because companies that do not use the debt market to fund their growth, must use their own money, that is, their earnings and the shareholders equity, to do it; hence, the Debt Risk = 1 + log(P/R) = 1 – log(Modality); please see Exhibit 2 below for how this applies to our income.
Exhibit 2: S&P TSX Rents Enterprise Risk & Debt Risk and What about our income?
 Figure 2.1: S&P TSX Rents – Enterprise Risk & Debt Risk |
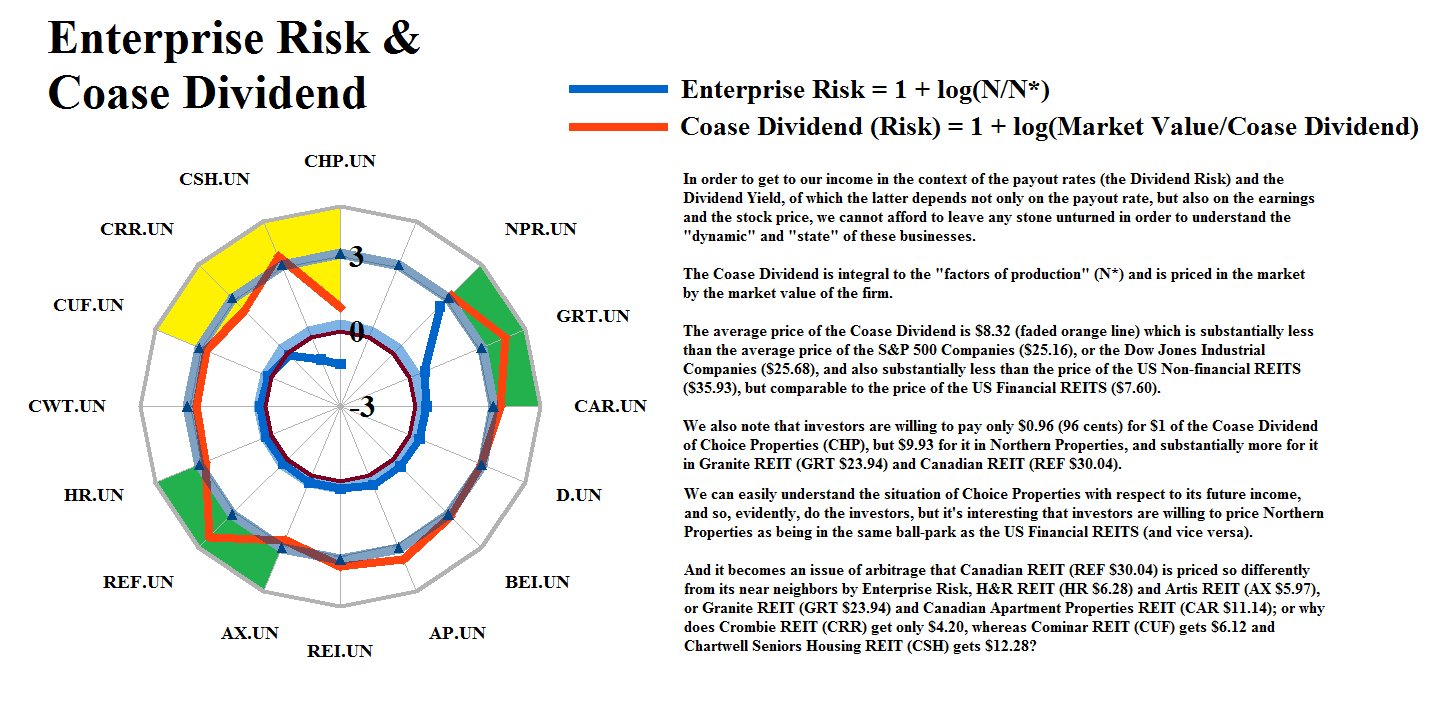 Figure 2.2: S&P TSX Rents – Enterprise Risk & Coase Dividend |
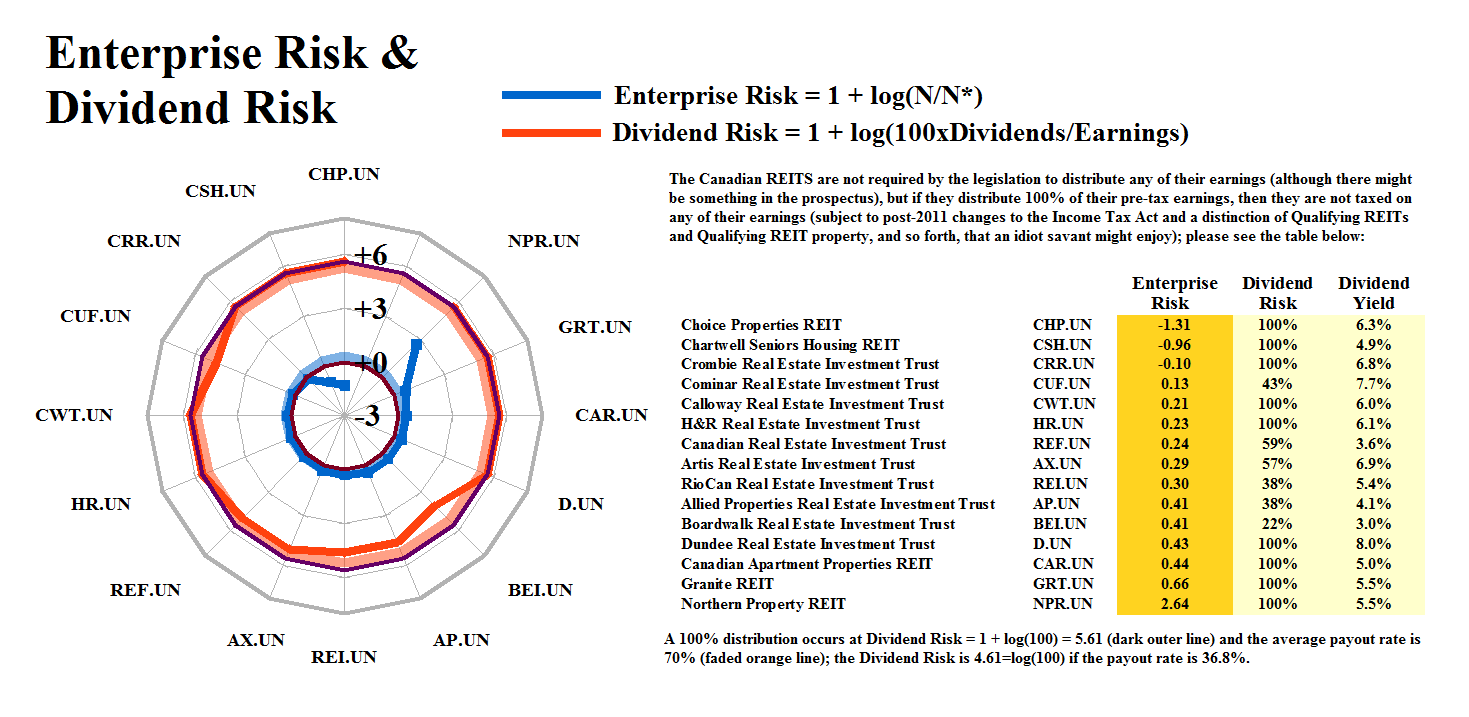 Figure 2.3: S&P TSX Rents – Enterprise Risk & Dividend Risk |
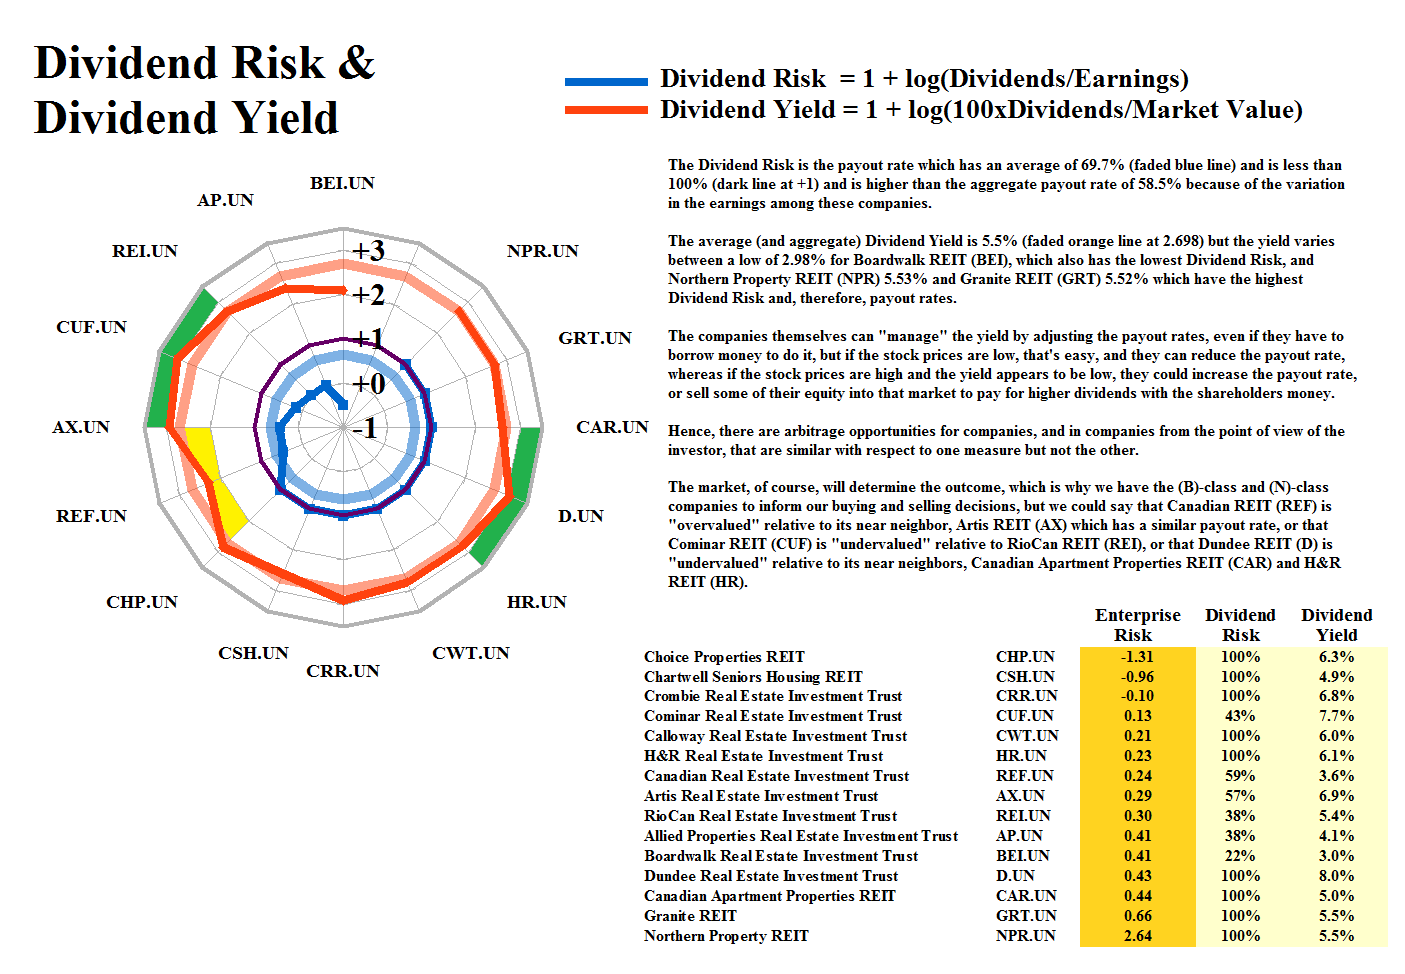 Figure 2.4: S&P TSX Rents – Dividend Risk & Dividend Yield |
For more information on the “Five Equations of State”, and an introduction to the terms that we have used here, please see our Post “(B)(N) Through the Looking-Glass“, and for the really hard rocks, the Theory of the Firm which is based on The Process.
And for more information on real “risk management” in modern times and additional references to the theory and how to read the charts and tables, please see our Post, The RiskWerk Company Glossary and “(P&I) Dividend Risk and Dividend Yield“, and our recent Posts “(P&I) The Profit Box” and “(P&I) The Process – In The Beginning“; and we’ve also profiled hundreds of companies in these Posts and the Search Box (upper right) might help you to find what you’re looking for, such as “(B)(N) TLM Talisman Energy Incorporated” or “(B)(N) ATHN AthenaHealth Incorporated” or “(B)(N) PETM PetSmart Incorporated“, to name just a few.
And for more applications of these concepts please see our Posts which rely on the Theory of the Firm developed by the author (Goetze 2006) which calibrates The Process to the units of the balance sheet and demonstrates the price of risk as the solution to a Nash Equilibrium between “risk-seeking” and “risk-averse” investors within the demonstrated societal norms of risk aversion and bargaining practice. And for more on The Process, please see our Posts The Food Chain and The Process End-Of-Process.
And for more on what risk averse investing has done for us this year, please see our recent Posts on “(P&I) The Easy (EC) Theory of the Capital Markets” or “(B)(N) The Easy (EC) Theory of the S&P 500“, and the past, The S&P TSX “Hangdog” Market or The Wall Street Put or specialty markets such as The Dow Transports & Utilities or (B)(N) The Woods Are Burning, or for the real class action, La Dolce Vita – Let’s Do Prada! and It’s For You, Dear on the smartphone business.
And for more stocks at high prices, The World’s Most Talked About Stocks or Earnings Don’t Matter – NASDAQ 100. And for more on what’s Working in America, Big Oil, Shopping in America or Banking in America, to name just a few.
Postscript
We are The RiskWerk Company and care not a jot for mutual funds, hedge funds, “alternative investments”, the “risk/reward equation” and every other unprovable artifact of investment lore. We have just one product
The Perpetual Bond™
Alpha-smart with 100% Capital Safety and 100% Liquidity
Guaranteed
With No Fees and No Loads on Capital
For more information on RiskWerk, please follow the Tags or Categories attached to this Letter or simply enter Search for additional references to any term that we have used. Related data may be obtained from us for free in a machine readable format by request to RiskWerk@gmail.com.
Disclaimer
Investing in the bond and stock markets has become a highly regulated and litigious industry but despite that, there remains only one effective rule and that is caveat emptor or “buyer beware”. Nothing that we say should be construed by any person as advice or a recommendation to buy, sell, hold or avoid the common stock or bonds of any public company at any time for any purpose. That is the law and we fully support and respect that law and regulation in every jurisdiction without exception and without qualification to the best of our knowledge and ability. We can only tell you what we do and why we do it or have done it and we know nothing at all about the future or the future of stock prices of any company nor why they are what they are, now. The author retains all copyrights to his works in this blog and on this website. The Perpetual Bond®™ is a registered trademark and patented technology of The RiskWerk Company and RiskWerk Limited (“Company”) . The Canada Pension Bond®™ and The Medina Bond®™ are registered trademarks or trademarks of the Company as are the words and phrases “Alpha-smart”, “100% Capital Safety”, “100% Liquidity”, ”price of risk”, “risk price”, and the symbols “(B)”, “(N)” and N*.
