(B)(N) The Canadian Bank Act
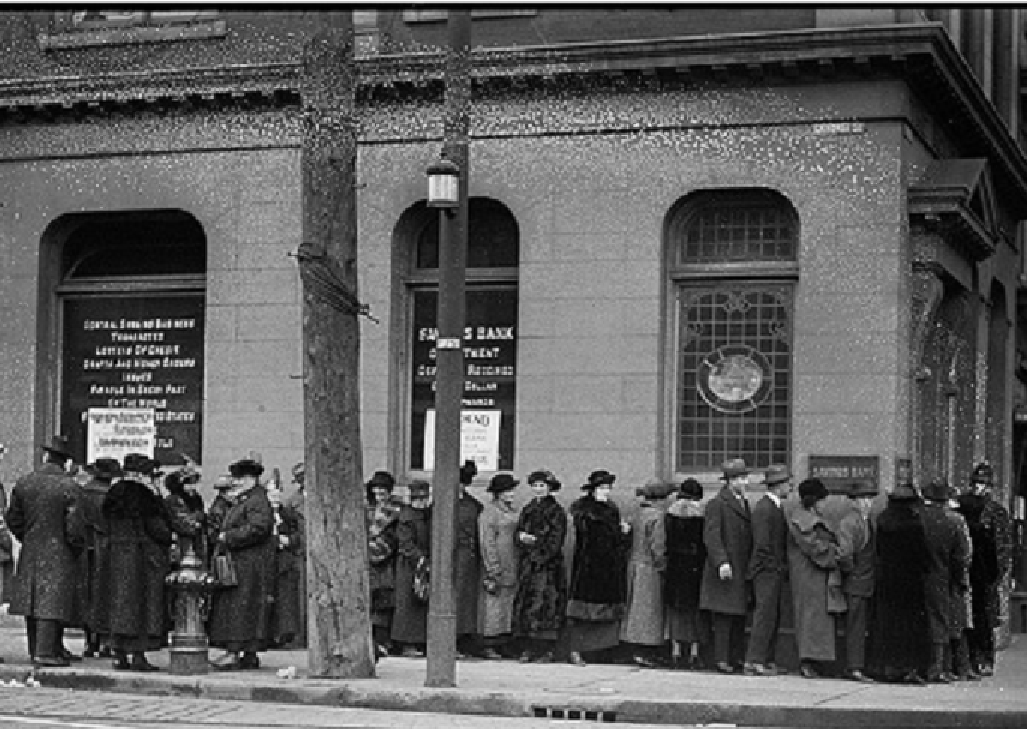
Home (Savings) Bank, Toronto, 1923
Drama. The Canadian chartered banks have never been “too big to fail”, but few of them ever have – we know of only three in recent times – the Home Bank in 1923 (ninety years ago), and the Canadian Commercial Bank (CCB) and the Northland Bank of Canada (NBC), both in 1985 on “investment issues”, although there were some “sensitive issues” in 2008 as well (The Huffington Post, May 1, 2012, Canada Bank Bailout: Yes, There Was One, And Here’s Why It’s Important To Remember That).
Nor are they “too small to succeed” – the top five hold $3.6 trillion in assets and are comparable to the Goldman Sachs Group, Morgan Stanley, the Bank of New York Mellon Corp, and U.S. Bancorp, but they are less than half (40%) the size of the top five US banks, in aggregate; and the smaller three have another $250 billion between them; please see Exhibit 1 below.

The “Left” Bank Business. Exciting, No?
However, the banks are getting a lot of attention (The Financial Post, August 7, 2014, Canadian banks win praise rather than scorn from regulators in contrast to U.S. and The Huffington Post, April 1, 2014, Canada’s ‘Too Big To Fail’ Bank Problem Is Worse Than U.S.: IMF) because nobody wants them to “fall off the rails”, least of all, their customers and the taxpayers, who might “have to” bail them out, and the CDIC (Canadian Deposit Insurance Corporation) and the FDIC (Federal Deposit Insurance Corporation), who might have to pay some of the depositors accounts.
Nevertheless, there are differences in the way in which the Canadian and US banks conduct their business and, absent fraud or malfeasance, the banks get into “liquidity” and “credit” trouble when they seek “unearned”, or “opportunistic”, investment profits on their “working” capital that are outside of the services that create their “business modality” which is α≈1.10.
And, unlike our friends in the media, and the IMF, who have lots of opinions, but no provable solutions, we know how to measure that difference, and that might make a difference, even in this season of “finger-pointing” and “speculation” and, at the end of the day, we’re out-of-school, aren’t we; please see below, and our earlier Post, “(P&I) The Banker’s Modality“, for additional background.
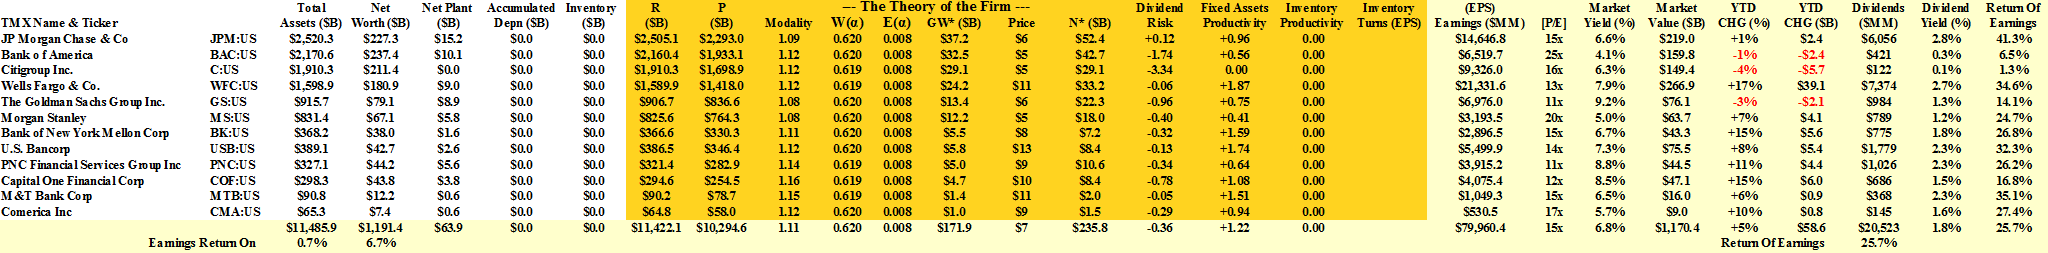
Exhibit 1: US & Canadian Banks – Fundamentals
US & Canadian Banks – Fundamentals
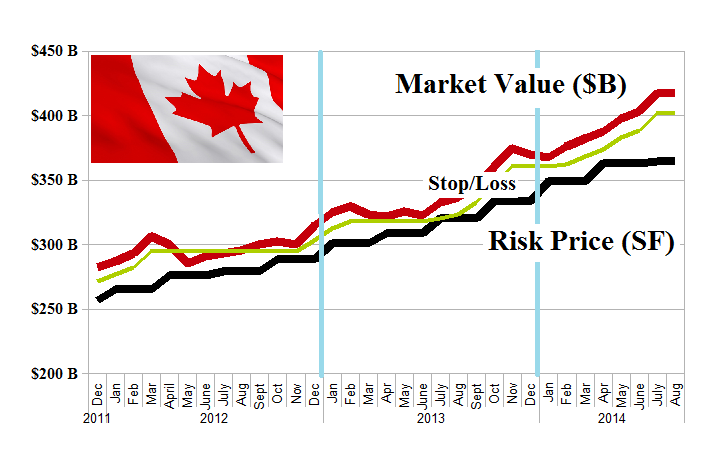
Figure 1.1: Canadian Banks – Risk Price Chart – August 2014
With reference to Exhibit 1, a few of the more obvious things that we notice are that the return on the shareholders equity of the Canadian banks is 15% whereas the US banks got only 7% last year.
The Canadian banks also returned 48% of their earnings for an aggregate dividend yield of 3.6%, whereas the US banks returned only 26% for an aggregate dividend yield of only 1.8%.
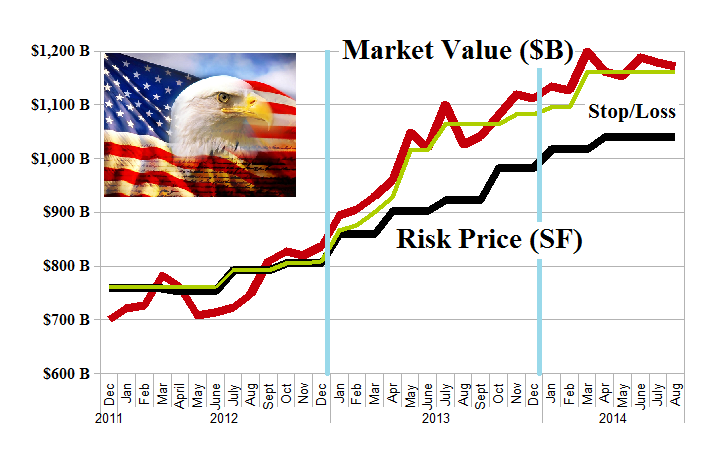
Figure 1.2: US Banks – Risk Price Chart – August 2014
Their return on assets, however, is comparable at 0.8% and 0.7%, and their [P/E]’s are 13× and 15×, respectively; please click on the links “Canadian Bank Fundamentals” and “US Bank Fundamentals“, by-the book, for further details.
So, which ones should we buy?
The answer is, all of them, on a buy & hold basis, with a reasonable stop/loss or sell policy (above the price of risk) in place.
Last year, the Canadian banks returned +17% and they’re up another +13% so far this year; and the US banks returned +33% and another +5% so far this year; please see Figure 1.1 and 1.2, above, on the left.
However, there is no predicting what “the market” will do because, when it comes to the banks, all they have is [P/E]’s and dividend yields, and we’ve looked at that already – and they don’t explain anything, as is also evident from Figure 1.1 and 1.2 above; please see Exhibit 2 below and, for more information, our recent Post, “(P&I) Dividend Risk & Dividend Yield“.
Moreover, there’s no correlation between “facts” – of which we have a lot – and “stock prices” because, if there was, everybody would know them.

Exhibit 2: S&P NYSE Dividend Risk and Dividend Yields
There are some differences, however, that are more fundamental to what a bank does for a living.

So cold …
For example, “Wealth Management”, colorful as it is, is just a “disinterested service” for fees, and is on the left bank – so cold – and maybe provides a “training ground” for future bankers, or a place to “dump” inventory, but it’s not their business, other than to compete for consumer cash; please see our recent Post, “(P&I) The Banker’s Modality” , for more information.
Exhibit 2: The Banker’s Modality
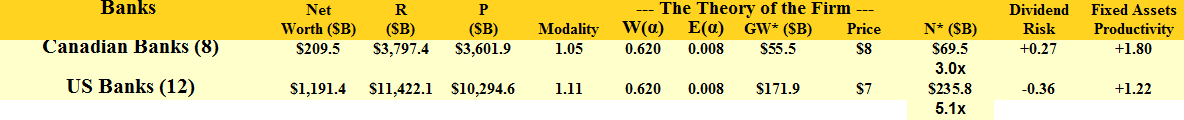
The real difference between the Canadian banks and the US banks is their modality which, by the books, is α=1.05 for the Canadian banks and α=1.11 for the US banks.
But that raises some concerns because if the actual modality – the “private modality” – is the same as “by the books”, then the US banks should be more profitable than they are; that is, their “Dividend Risk” should be higher; and their “Fixed Asset Productivity” should be higher; and their return on the shareholder’s equity, should be higher (noted above as 7% for the US banks and 15% for the Canadian banks); and (N*) should not have to “work” so hard (3× for the Canadian banks, and 5× for the US banks) to “support” the shareholders equity; please see Exhibit 2 above, and our recent Post, “(P&I) Productivity“, for more information on how “risk” and “productivity” are defined and measured.
The Banker’s Private Modality
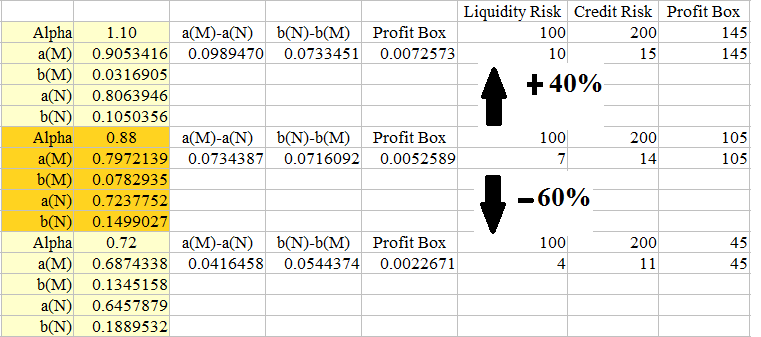
Figure 2.1: Liquidity & Credit Risk – Private Modality α=0.88
Their “Inventory Productivity” is missing from Exhibit 2, because they don’t report it.
In other words, if (I) are the “investment assets (net)” and (T) are the “trading assets”, as reported on their balance sheet, we need to know how much of that is a “liquidity risk” (μ×I), or a “credit risk” (ν×T), where 0<μ,ν<1, because that determines their actual, or “private modality”, and raising it, increases their profitability, because it surely isn’t α=1.11, as by the books, because decreasing it, decreases their profitability, and it’s not negotiable at α=0.5; please see Figure 2.1 on the right for an example of how modality affects “liquidity” and “credit risk” profits, and for more details, our Post, “(P&I) The Banker’s Modality“.
Because of these differences in “profitability”, we know that their “private modality” is less than their “public modality”, α=1.11, by the books.
And it will be below the “private modality” of the Canadian banks because their modality is also not α=1.05, and is similarly missing (μ) and (ν), but their demonstrated “profitability” is higher than the US banks.

So, you say you’re a bank?
But, that’s all we need know and the difference explains the difference in profitability that we can see from the fundamentals (Exhibit 2) – that is, the differences are observables, and can’t be hidden, and they’re all about what the bank’s business really is; please see Exhibit 3 below.
Exhibit 3: The Private Modality
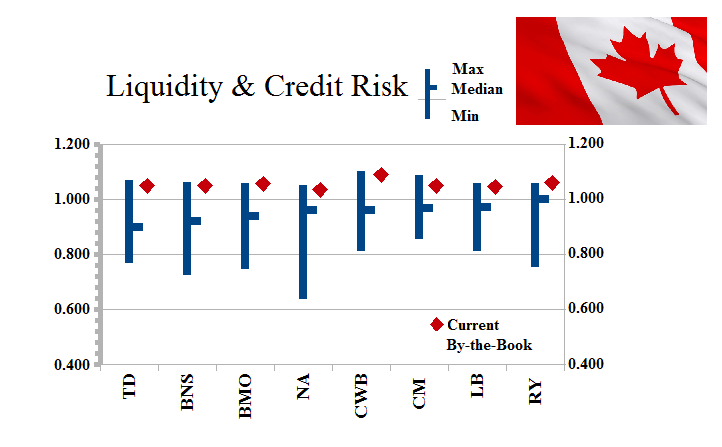 Figure 3.1: The Canadian Banks – Private Modality |
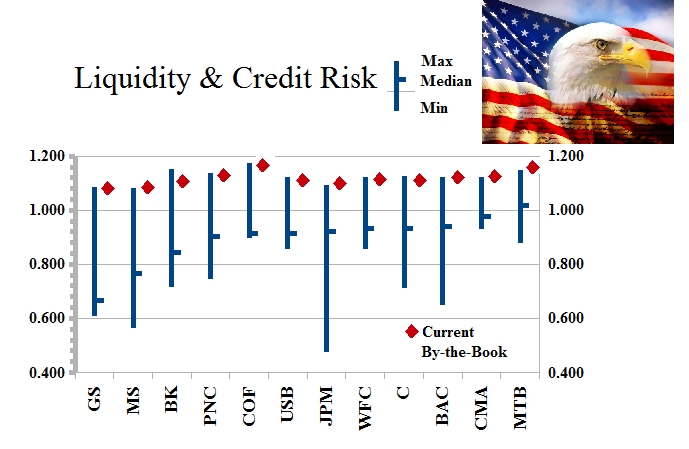 Figure 3.4: The US Banks – Private Modality |
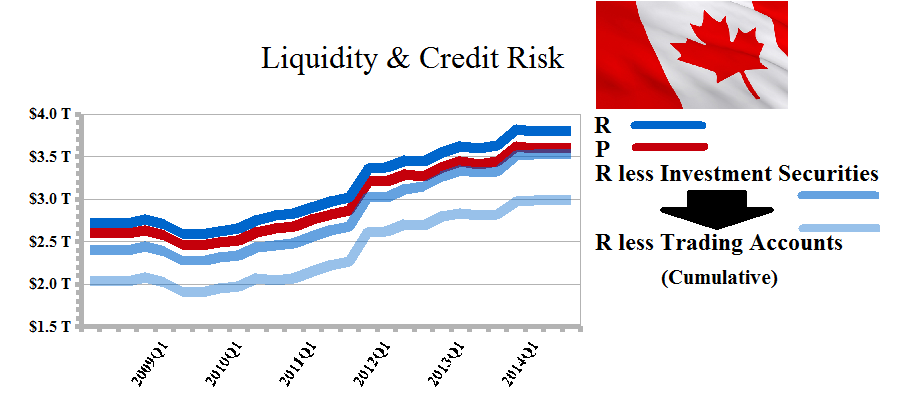 Figure 3.2: The Canadian Banks – R P |
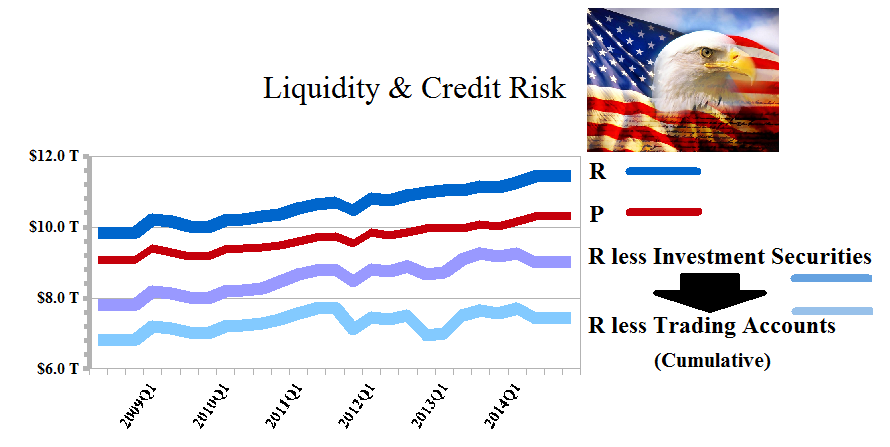 Figure 3.5: The US Banks – R P |
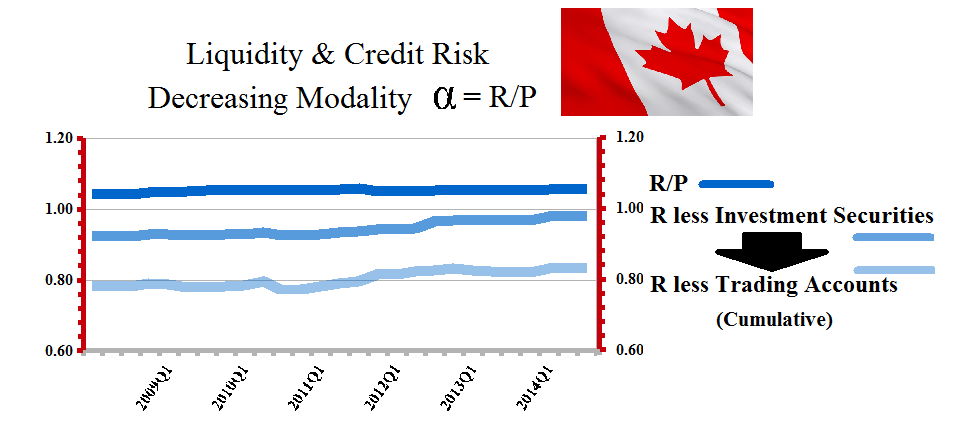 Figure 3.3: The Canadian Banks – R Over P |
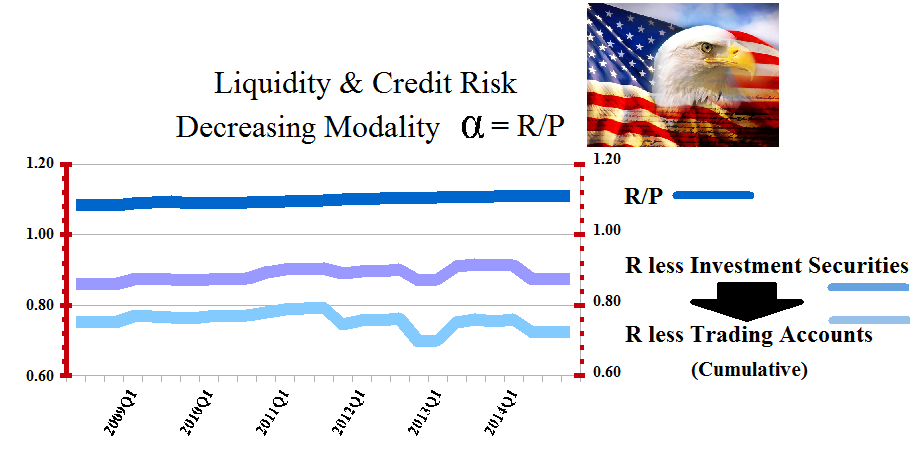 Figure 3.6: The US Banks – R Over P |
For more information and additional guides to the theory, please see our Posts “(P&I) The Process – The 1st Real Dollar” which shows how a “currency” gets its value from the “subsistence economy” at the Company D modality, and “(P&I) The Process – The Guns of August” which explains how that modality actually “works”.
For more applications of these concepts please see our Posts which rely on the Theory of the Firm developed by the author (Goetze 2006) which calibrates The Process to the units of the balance sheet and demonstrates the price of risk as the solution to a Nash Equilibrium between “risk-seeking” and “risk-averse” investors within the demonstrated societal norms of risk aversion and bargaining practice. And for more on The Process, please see our Posts The Food Chain and The Process End-Of-Process.
And for more information on real “risk management” and additional references to the theory and how to read the charts and tables, please see our Post, The RiskWerk Company Glossary; we’ve also profiled hundreds of companies in these Posts and the Search Box (upper right) might help you to find what you’re looking for.
And for more on what risk averse investing has done for us this year, please see our recent Posts on The S&P TSX “Hangdog” Market or The Wall Street Put or specialty markets such as The Dow Transports & Utilities or (B)(N) The Woods Are Burning, or for the real class action, La Dolce Vita – Let’s Do Prada! and It’s For You, Dear on the smartphone business.
And for more stocks at high prices, The World’s Most Talked About Stocks or Earnings Don’t Matter – NASDAQ 100. And for more on what’s Working in America, Big Oil, Shopping in America or Banking in America, to name just a few.
Postscript
We are The RiskWerk Company and care not a jot for mutual funds, hedge funds, “alternative investments”, the “risk/reward equation” and every other unprovable artifact of investment lore. We have just one product
The Perpetual Bond™
Alpha-smart with 100% Capital Safety and 100% Liquidity
Guaranteed
With No Fees and No Loads on Capital
For more information on RiskWerk, please follow the Tags or Categories attached to this Letter or simply enter Search for additional references to any term that we have used. Related data may be obtained from us for free in a machine readable format by request to RiskWerk@gmail.com.
Disclaimer
Investing in the bond and stock markets has become a highly regulated and litigious industry but despite that, there remains only one effective rule and that is caveat emptor or “buyer beware”. Nothing that we say should be construed by any person as advice or a recommendation to buy, sell, hold or avoid the common stock or bonds of any public company at any time for any purpose. That is the law and we fully support and respect that law and regulation in every jurisdiction without exception and without qualification to the best of our knowledge and ability. We can only tell you what we do and why we do it or have done it and we know nothing at all about the future or the future of stock prices of any company nor why they are what they are, now. The author retains all copyrights to his works in this blog and on this website. The Perpetual Bond®™ is a registered trademark and patented technology of The RiskWerk Company and RiskWerk Limited (“Company”) . The Canada Pension Bond®™ and The Medina Bond®™ are registered trademarks or trademarks of the Company as are the words and phrases “Alpha-smart”, “100% Capital Safety”, “100% Liquidity”, ”price of risk”, “risk price”, and the symbols “(B)”, “(N)” and N*.
