(P&I) Productivity
Essay. Good companies don’t necessarily get “good” stock prices, and that’s more the rule than it is the exception because the dividend yields of companies that aggressively return earnings – in excess of 36.8% of their earnings – tend to be about 100 basis points above the dividend yields of companies that don’t, and the explanation is not in the higher rates of the return of earnings -which would be a rational explanation and a boon to virtue – but in the relatively lower stock prices for the former and higher stock prices for the latter.
The benchmark for “good” is that a good dividend yield is between 2% and 3% in the current environment, and even over the long term, and dividend yields of 3% to 4% are deemed “spectacular” and only expected from utility companies, for which they are deemed “expected” and “ordinary”; the following three charts from the Dow Industrials, Transports, and Utilities, demonstrate that principle and the differences:
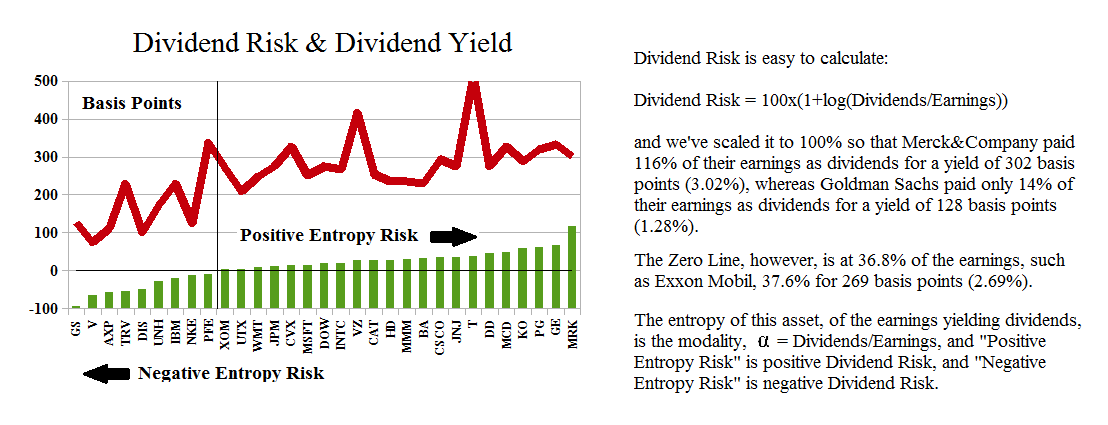
Exhibit 1: Dividend Risk & Dividend Yield
 Figure 1.1: Dow Industrials Dividend Risk and Dividend Yield |
 Figure 1.2: Dow Transports Dividend Risk and Dividend Yield |
 Figure 1.3: Dow Utilities Dividend Risk and Dividend Yield |
With respect to Figure 1.1, the companies on the left, beginning with Goldman Sachs through Pfizer Incorporated, all returned less than 36.8% of their earnings as dividends to the shareholders; the aggregate rate is 26.5% and the aggregate dividend yield is 1.8%, and the return on the shareholders equity is 20.9%.
The companies on the right, however, beginning with Exxon Mobil through Merck & Company, all returned more than 36.8% of their earnings to the shareholders and the aggregate rate is 49.3% for an aggregate dividend yield of 3.0% and a return on equity of 17.4%.
Moreover, the former paid $18.7 billion in dividends and the latter, $118 billion but, of course, there are more of them; it’s also noteworthy that both the left and the right returned more than 15% on the shareholders equity, and most investors can’t do that in any year, let alone every year.
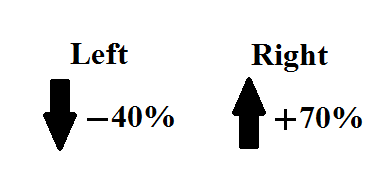
“Overvalued” “Undervalued”
The stock prices of the companies on the left would have to decrease by 40% to provide a 3% dividend yield, whereas the stock prices on the right would have to increase by 70% to give us a 1.8% dividend yield.
In other words, the companies on the left would appear to be “overvalued” whereas the companies on the right would appear to be “undervalued” relative to them.
Dow Industrials Dividend Risk & Dividend Yield
Calculating the “risk-adjusted dividend return on earnings” is quite easy and explained in the chart on the right, and it has nothing to do with “volatility” or “statistics”; for more details. please see our Posts “(P&I) The Process – Entropy Risk” and “(P&I) The Process – Dividend Risk & Dividend Yield“.
The non-intuitive implication is that “good companies” could reduce their payout rate, and still be “good” if not so much, and by so doing, might even boost their stock price.
For more information on the theory, please see our Posts “(P&I) The Process – The 1st Real Dollar” which shows how a “currency” gets its value from the “subsistence economy” at the Company D modality, and “(P&I) The Process – The Guns of August” which explains how that modality actually “works”.
For more applications of these concepts please see our Posts which rely on the Theory of the Firm developed by the author (Goetze 2006) which calibrates The Process to the units of the balance sheet and demonstrates the price of risk as the solution to a Nash Equilibrium between “risk-seeking” and “risk-averse” investors within the demonstrated societal norms of risk aversion and bargaining practice. And for more on The Process, please see our Posts The Food Chain and The Process End-Of-Process.
And for more information on real “risk management” and additional references to the theory and how to read the charts and tables, please see our Post, The RiskWerk Company Glossary; we’ve also profiled hundreds of companies in these Posts and the Search Box (upper right) might help you to find what you’re looking for.
And for more on what risk averse investing has done for us this year, please see our recent Posts on The S&P TSX “Hangdog” Market or The Wall Street Put or specialty markets such as The Dow Transports & Utilities or (B)(N) The Woods Are Burning, or for the real class action, La Dolce Vita – Let’s Do Prada! and It’s For You, Dear on the smartphone business.
And for more stocks at high prices, The World’s Most Talked About Stocks or Earnings Don’t Matter – NASDAQ 100. And for more on what’s Working in America, Big Oil, Shopping in America or Banking in America, to name just a few.
Postscript
We are The RiskWerk Company and care not a jot for mutual funds, hedge funds, “alternative investments”, the “risk/reward equation” and every other unprovable artifact of investment lore. We have just one product
The Perpetual Bond™
Alpha-smart with 100% Capital Safety and 100% Liquidity
Guaranteed
With No Fees and No Loads on Capital
For more information on RiskWerk, please follow the Tags or Categories attached to this Letter or simply enter Search for additional references to any term that we have used. Related data may be obtained from us for free in a machine readable format by request to RiskWerk@gmail.com.
Disclaimer
Investing in the bond and stock markets has become a highly regulated and litigious industry but despite that, there remains only one effective rule and that is caveat emptor or “buyer beware”. Nothing that we say should be construed by any person as advice or a recommendation to buy, sell, hold or avoid the common stock or bonds of any public company at any time for any purpose. That is the law and we fully support and respect that law and regulation in every jurisdiction without exception and without qualification to the best of our knowledge and ability. We can only tell you what we do and why we do it or have done it and we know nothing at all about the future or the future of stock prices of any company nor why they are what they are, now. The author retains all copyrights to his works in this blog and on this website. The Perpetual Bond®™ is a registered trademark and patented technology of The RiskWerk Company and RiskWerk Limited (“Company”) . The Canada Pension Bond®™ and The Medina Bond®™ are registered trademarks or trademarks of the Company as are the words and phrases “Alpha-smart”, “100% Capital Safety”, “100% Liquidity”, ”price of risk”, “risk price”, and the symbols “(B)”, “(N)” and N*.
