(P&I) The Banker’s Modality

A “Banking Crisis”, you think?
Essay. Banks are in the “brokerage business” and it is their business to accept deposits and re-allocate them to investments of all sorts, for which they earn a fee and, possibly, an investment return if some of that investment is on their own account, such as consumer credit and consumer and business loans that they make with “borrowed” money and our money as deposits entrusted to them.
And the competition is fierce for our dollar, including “other banks, brokerage firms, investment banking companies, merchant banks, hedge funds, commodity trading companies, private equity firms, insurance companies, mutual fund companies, investment managers, credit card companies, mortgage banking companies, trust companies, securities processing companies, automobile financing companies, leasing companies, e-commerce and other Internet-based companies, and a variety of other financial services and advisory companies” – Annual Report, JP Morgan Chase & Company – all of which business they do, routinely, efficiently, seamlessly, every day, in millions of transactions of nearly any amount.

A User’s Guide To Banking
As a result, they tend to have a modality of α≈1.08 to α≈1.12 when they are on the “buy-side” of the business – that is, they don’t have to take our accounts or pay us anything for our money (and they don’t, despite the “competition” for it) – nor do they have anything particular to “sell” when they are on the “buy-side” and the business is coming to them for the many services that they offer.
But they get into trouble when they are on the “sell-side” of the business for their own accounts and when their investments – with our money and theirs – are sitting on the shelf, looking and waiting for buyers.
For example, the response of the banks to the repeal of certain provisions in the Glass-Steagall Act of 1933 by the Gramm–Leach–Bliley Act of 1999, was to “jump-in” to the investment banking and merchant banking businesses on a proprietary basis, and to “jump-out” in 2007 and subsequently subject to the Dodd-Frank Act in 2010 and the Volcker Rule in 2013 (Reuters, August 20, 2013, JPMorgan named top commodities bank, day after selling physical business).

Figure 1: The Blue-Box Problem
And the problem that they get into on the “sell-side” is the “blue-box problem”, more popularly known for “re-cycling” – which is what banks do, they re-cycle “old money” – but we know it as the “profit box” which “shrinks” faster than linearly on either side of the “bank” modality α=1.10; please see the chart on the right which we’ll describe in more detail below.
The banks’ excursions into “wealth management” will not affect their modality, but might enhance their earnings at the expense of their customers’ interests in obtaining an investment return – 100% capital safety, 100% liquidity, and a hopeful but not necessarily guaranteed return above the rate of inflation – none of which are guaranteed by the banks service of “wealth management” which is often touted – to its shareholders – as a giant source of new revenue, but not so much for their customers where it would do a lot of good (Reuters, April 17, 2014, Morgan Stanley profit soars on wealth management, trading).

Wealth Management, a service so cold …
In our view, however, there are better alternatives to “wealth management” pro forma even if we have too much money to “manage” it ourselves; please see any of our Posts on “(B)(N) What’s A Girl To Do?” for other ideas but, on balance, we don’t see a brave new future in “wealth management” that is a service so cold that they need to keep their hands in our pockets in all seasons.
Again, the JP Morgan Chase & Company, is a paragon in that field and manages about $3.8 trillion of customer assets (which don’t appear in its books), but they only made about $2 billion (0.05% or 5 basis points) on it, after expenses, which is about 14% of their net earnings, and up 19% from the year before, but they’ll need another $8 trillion in that to compete with their main-line businesses in consumer, corporate and investment banking; please see their Annual Report for more details.
This doesn’t work …
Moreover, their customers should have made $550 billion (15%) on it – of which we have no report or headlines – which is the baseline for professional management in a vibrant market, and safe, liquid, and hopeful, in all markets, and would wipe-out the competition but can’t be had by “random punting” and the gleeful concierge services that pass for “investment management” so cold (The Wall Street Journal, March 21, 2014, Banks pull out all the stops for the ultra-rich).

Courtesy: JPMorgan Chase & Company
Of all the risks that the banks have, regulatory risk, on back-lash, and reputational hazards are probably the most difficult and long-lasting to deal with, and the banks have taken, and are taking, those risks for which “Banking in America” is undergoing significant cultural changes in the next few years – from Hollywood to Main Street; please see below for more details on the epidemic of risk for which the pursuit of “volatility” and the “risk appetite” are the only cause.
The Un-booked Banker’s Modality
Subject to the Volcker Rule (2013), the banks are becoming more careful of proprietary trading on their own account, but still hold vast amounts of securities on-the-shelf pending their sale to customers who have demanded these services and for which the banks “make markets”.
All such transactions create both liquidity and credit risk, and a chain of transactions, interlinked, is only as good as the weakest link, and there are millions of such transactions every day, for which “market conditions” might create a lot of weak-links.
Exhibit 1: Liquidity & Credit Risk
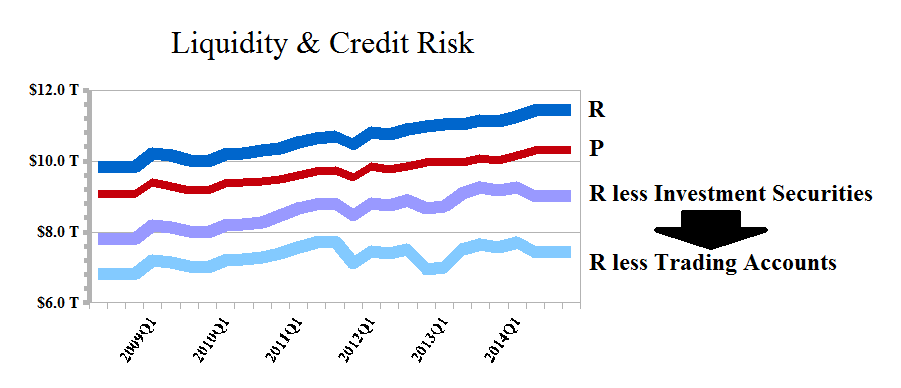
Figure 1.1: R “what is owed to us” and P “what we owe”
In our usual notation, (P) is “what we owe”, our “total liabilities”, including short and long-term debt, preferred shares, and minority interest (if any), which can be read from any balance sheet.
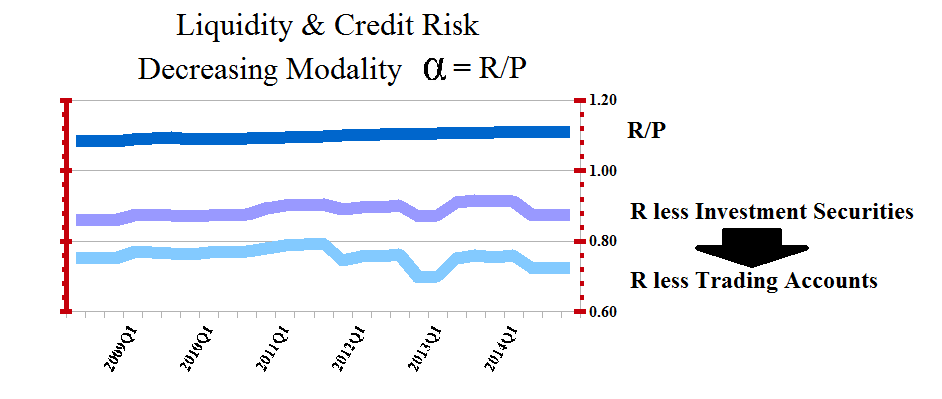
Figure 1.2: Modality Under Increasing Credit & Liquidity Risk
(R) is “what is owed to us” and that is an “economic concept” developed in The Theory of the Firm, but it is basically the total assets plus the accumulated depreciation less “what we own” which is, figuratively, the “inventories”, or “product for sale”, and the “net plant & equipment” or “fixed assets” which are not for sale.
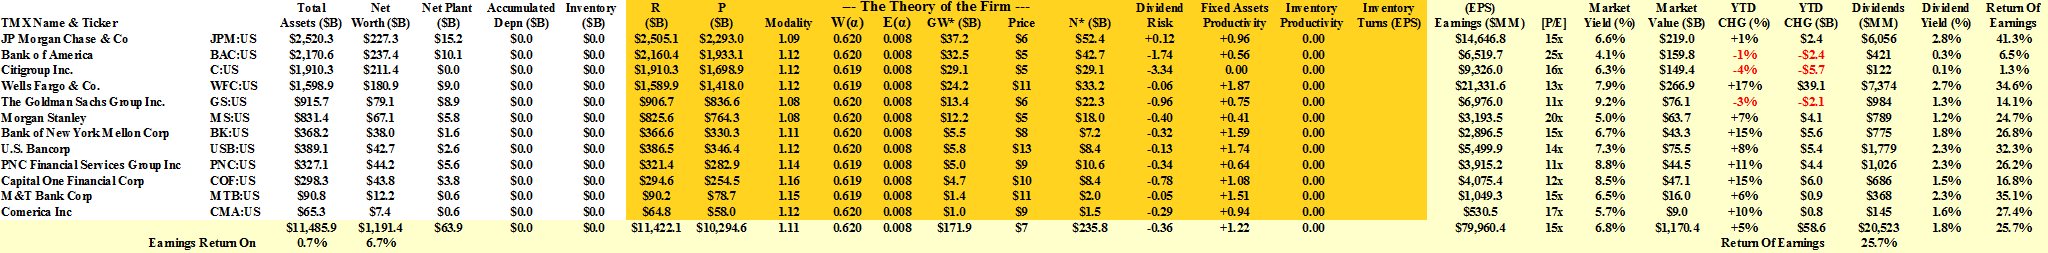
In the case of the twelve largest US banks, those numbers are currently (P) $10.3 trillion and (R) $11.4 trillion so that, by the books, the modality is α=R/P=1.11; please see Figure 1.1 and 1.2 on the left (the dark blue (R) and red (P) lines) and, for more details, Exhibit 2 below (and click on it to make it larger, and again, if required).
Exhibit 2: The Banks By-The-Book
However, that’s not the whole story.
At the present time, the banks hold $2.4 trillion in “investment securities”, and a further $4.0 trillion in “trading account assets” which, if they owned them all (100%), would create a “liability” of $6.4 trillion, because those assets need to be sold (or “received”), and until they’re sold, or the contracts for them are completed, they are a part of the banks’ “inventory” which they might have to write-down (or up) if they can’t be sold for the price that they paid for them – with the depositors’ money and such other borrowings as the banks might have – and those amounts are at least twice the depositors’ accounts, and more than five times the banks’ net worth ($1.2 trillion).
The banks, of course, don’t “own” 100% of those assets, and there are already “receivables” on them, or most of them subject to the Volcker Rule, the Dodd-Frank Act, and numerous other liquidity constraints on the bank’s capital, but until the “receivables” are “receipts”, their private modality is pushed downwards from α=1.1 to α=0.88 to α=0.72, in the most extreme case, and is somewhere between those numbers depending on the banks “risk appetite” and the feasibility of it; please see Figure 1.2 above, which makes the reasonable assumption that the banks’ liabilities, (P) in Figure 1.1, will remain the same or increase due to new deposits and depositor accounts, or other borrowing, because that’s their business and the source of their “capital”.

Figure 2: Liquidity & Credit Risk By Modality
Figure 2, on the left, shows the exposure of the banks to liquidity and credit risk since 2009, where the range assumes 100% “proprietary interest” in both the investment assets and the trading account.
The actual exposure will be somewhere in between, but almost certainly greater (lower modality) than the modality that is calculated “by-the-book” (the red dots) and it would be determined by the bank’s policy as implemented in the day-to-day “risk management” and trading limits, or margins, based on “volatility”.
However, the “median values” represent, on balance, a 30% to 50% “proprietary interest” in the investment and trading accounts (please see Figure 1.1 above), and the banks themselves can readily calculate what it is; please see the Appendix below for an example.
The reason that it’s important is that the “profit box” shrinks from its maximum size at a modality of α≈1.10, and it could be as much as 50% smaller (please see Figure 1 above), and the “worth” of it is determined by the bank’s “receivables” (R) and “payables” (P) in actual dollars; excess profits need to be “earned” as “investment profits” and are not built-in to the banks’ usual clearing and service fees, and other operations, which determine its modality absent a “proprietary interest” of some sort; moreover, it’s not all about “profits” – losses are also a possibility – and profits or losses could be built-in to its “process”.
The “Incredible Shrinking” Profit-Box
The “units” in a process model are arbitrary, but “relative”, and can be calibrated to the units of the balance sheet by setting R+P=1, so that if α=R/P is the modality, P=1/(1+α) and R=α/(1+α), and the receivables sets, (b), and payables sets, (a), which occur in-process with probability, or measure, a=p((a)) and b=p((b)), also obtain “values” with respect to that unit; in Figure 1, above, we are using “%” as the “unit” so that 1=100%.
Exhibit 3: The Banker’s Modality α=1.10
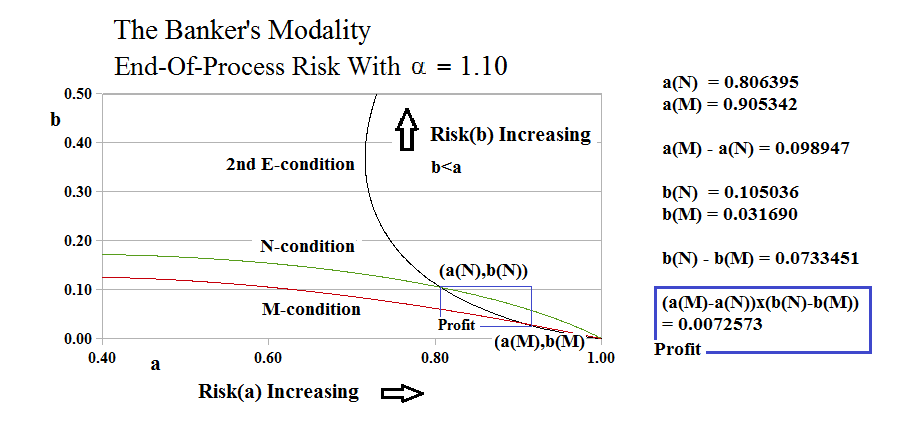
Figure 3.1: The Banker’s Modality
The diagram on the left, Figure 3.1, is a “state diagram” and shows what must happen in order that the “producer” (the bank) can deliver its “product” at the exchange values, a=b=1, and the “customer” (the trading connections) can receive the product, and, at the end of the exchange, the “process” that produces the product maintains its modality and its relationship to the customer, which relationship must be of the form a×log(a) = α×log(b) and b×log(b) = α×log(a), the 1st and 2nd E-conditions, respectively, wherever we can make a distinction by merely counting, and there is a conservation law, which in this case, is the balance sheet; please see our Post, “The Process“, for more details.
In most businesses, physical products and services are “produced” and “paid for”, but the business doesn’t end with the “production of product”, and the process, in-process, never actually assumes the values a=b=1, because if it did, the process would end.
The condition for the production of the product at the end-of-process is the N-condition, 1+log(a) = lim (1/b^α)×log(1-b^α) as a→1 and Δa→0 and Δb→0, and the condition for the receipt of product at the end-of-process is the M-condition, 1+log(a) = lim (1/b^α)×log(1+b^α) as b→1 and Δa→0 and Δb→0, where the sets of payables, (a), and receivables, (b), are developed independently of each other in the process space of the producer, on one side, and the process space of the customer, on the other, and the nexus is that for such (a) and (b) that are developed, they are constrained by the 1st and 2nd E-conditions, in-process, and a→1 and b→1 as Δa→0 and Δb→0.
Figuratively, the N-condition describes the process by which the producer “completes the product”, and the M-condition describes the process by which the customer is able to pay for it; however, the “product” is “complete”, in-process, at (a(N),b(N)) but can’t be received, or “paid-for”, in-process, until (a(M),b(M)), which always completes the transaction with a(M)>a(N) and b(M)<b(N) for all α>0.5 (although other things are possible for α<0.5, and a(M)=a(N) and b(N)=b(M) at α=0.5).
In effect, the producer is going “bottom-up”, as a→1 and a<1, because he has more control over his payables, whereas the customer is going “top-down”, as b→1 and b<1, because “they” have less control over their receivables.

How much, do you think?
That means that between a(N)≤a≤a(M) and b(M)≤b≤b(N), there’s “room” to negotiate a different “price”, in-process, that could be advantageous to both parties; for example, the “producer” effectively “discounts” his product by accepting a larger set of payables, (a), and a smaller set of receivables, (b), but still larger than b(M), and still smaller than a(M).

Figure 3.2 Reflection
On the other hand, at the end-of-process and the completion of delivery and receipt of product, at (a,b), the producer has (b,a) in production, which is the reflection of the end-of-process at (a,b) to the beginning of process at (b,a) in the equality, a=b, the diagonal line of the process space; please see Figure 3.2 on the right.
Moreover, it’s evident that these transactions have only to do with credit and liquidity; (a) was a payable, now it’s a receivable; and (b) was a receivable, now it’s a payable, in-process, with the obvious implications for the customer for whom these are payables and receivables, respectively, and who could have made a better or different deal in the “blue-box”. Quid pro quo.
Exhibit 4: The “Incredible Shrinking” Profit-Box
|
Figure 4.1: The Banker’s Modality α=1.10 |
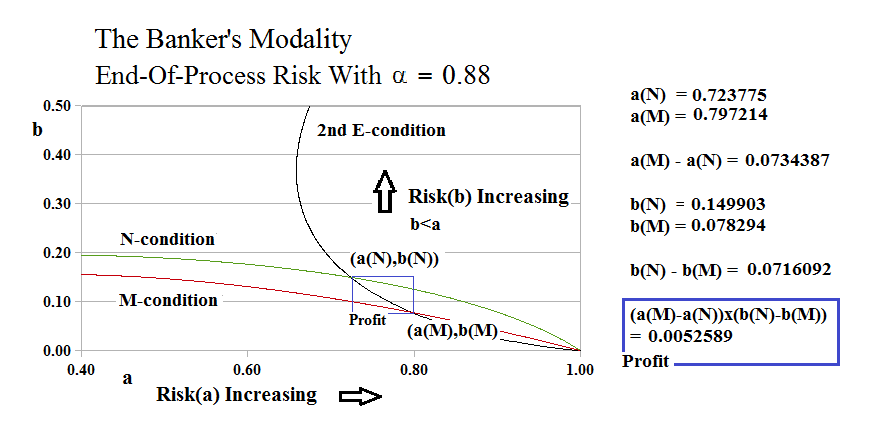 Figure 4.2: The Banker’s Modality α=0.88 |
 Figure 4.3: The Banker’s Modality α=0.72 |

Customer?
But, not to worry – it’s just business and the banks will know what to do (Bloomberg, August 5, 2014, Big U.S. Banks’ ‘Living Wills’ Get Failing Grade).
Appendix: Liquidity & Credit Risk
The bank has liquidity and credit risk in both of its investment banking (I) and trading account (T) assets, even if the bank has no “proprietary interest” in either of them; in that case, all of its profits are fees-based, and we can assume that those are paid in cash, but it still has “inventory” on the shelf which, if it’s an asset on its balance sheet, it has paid for, and they need to be “picked-up” and “paid for” by the customers for whom its holding them, and that is both a “liquidity risk” (payables) because the bank can’t use those assets to make loans and might not be earning a loan-like return on them, and a “credit risk” (receivables) because the customers might not be able to pay for them, and in some cases, the customers don’t exist yet because those assets need to be sold, such as in an IPO or “bought deal” to float new stock or bonds.
If the bank’s modality is α = R/P, by the books, then those assets (I+T) are included in its “total assets” and, therefore, in (R), but if it takes a proprietary interest in them, say μI+νT with 0<μ,ν<1, then those assets become a part of its “inventory” and the banks modality is decreased to α=α(Private) = (R-(μI+νT))/P.
But the bank’s “Profit Box” at α=α(Private) exists in part because of its fees, but also because it has “invested” its assets in the credit of its customers, of which it has become one if it effectively buys and owns μI+νT; therefore, if the bank calculates, for example, a 100-basis point risk in “liquidity” (payables, a), and a 200-basis point risk in “credit” (receivables, b), then its “profit box” shrinks unless it can use those assets to reduce its payables (P), or increase its receivables (R), by selling those assets at a possibly higher price than it paid for them.
For example, if the bank knows that its “private modality” is α(Private)=0.88 (Figure 4.2 above), and it expects a 100-basis point liquidity risk and a 200-basis point credit risk with respect to its “production” in that case, then the “Profit Box” is “worth” 105 basis points, but if it can increase its modality to α=1.10 (Figure 4.1), then the “Profit Box” is worth 145 basis points (a 40% increase).

Figure 4.4: Liquidity & Credit Risk Private Modality
But if it takes an even larger interest in (I) and (T) and reduces its modality to α=0.72 (Figure 4.3), then the “Profit Box” is worth only 45 basis points (a 60% decrease); please see Figure 4.4 on the right.
For more information and additional guides to the theory, please see our Posts “(P&I) The Process – The 1st Real Dollar” which shows how a “currency” gets its value from the “subsistence economy” at the Company D modality, and “(P&I) The Process – The Guns of August” which explains how that modality actually “works”.
For more applications of these concepts please see our Posts which rely on the Theory of the Firm developed by the author (Goetze 2006) which calibrates The Process to the units of the balance sheet and demonstrates the price of risk as the solution to a Nash Equilibrium between “risk-seeking” and “risk-averse” investors within the demonstrated societal norms of risk aversion and bargaining practice. And for more on The Process, please see our Posts The Food Chain and The Process End-Of-Process.
And for more information on real “risk management” and additional references to the theory and how to read the charts and tables, please see our Post, The RiskWerk Company Glossary; we’ve also profiled hundreds of companies in these Posts and the Search Box (upper right) might help you to find what you’re looking for.
And for more on what risk averse investing has done for us this year, please see our recent Posts on The S&P TSX “Hangdog” Market or The Wall Street Put or specialty markets such as The Dow Transports & Utilities or (B)(N) The Woods Are Burning, or for the real class action, La Dolce Vita – Let’s Do Prada! and It’s For You, Dear on the smartphone business.
And for more stocks at high prices, The World’s Most Talked About Stocks or Earnings Don’t Matter – NASDAQ 100. And for more on what’s Working in America, Big Oil, Shopping in America or Banking in America, to name just a few.
Postscript
We are The RiskWerk Company and care not a jot for mutual funds, hedge funds, “alternative investments”, the “risk/reward equation” and every other unprovable artifact of investment lore. We have just one product
The Perpetual Bond™
Alpha-smart with 100% Capital Safety and 100% Liquidity
Guaranteed
With No Fees and No Loads on Capital
For more information on RiskWerk, please follow the Tags or Categories attached to this Letter or simply enter Search for additional references to any term that we have used. Related data may be obtained from us for free in a machine readable format by request to RiskWerk@gmail.com.
Disclaimer
Investing in the bond and stock markets has become a highly regulated and litigious industry but despite that, there remains only one effective rule and that is caveat emptor or “buyer beware”. Nothing that we say should be construed by any person as advice or a recommendation to buy, sell, hold or avoid the common stock or bonds of any public company at any time for any purpose. That is the law and we fully support and respect that law and regulation in every jurisdiction without exception and without qualification to the best of our knowledge and ability. We can only tell you what we do and why we do it or have done it and we know nothing at all about the future or the future of stock prices of any company nor why they are what they are, now. The author retains all copyrights to his works in this blog and on this website. The Perpetual Bond®™ is a registered trademark and patented technology of The RiskWerk Company and RiskWerk Limited (“Company”) . The Canada Pension Bond®™ and The Medina Bond®™ are registered trademarks or trademarks of the Company as are the words and phrases “Alpha-smart”, “100% Capital Safety”, “100% Liquidity”, ”price of risk”, “risk price”, and the symbols “(B)”, “(N)” and N*.
