(B)(N) The Broken-Down Breakout Stocks

The Broken-Down Breakout Stocks
Drama. For more than a hundred years, mathematicians have been intrigued by stocks and how their prices wax and wane, tumble up and tumble down, rise and fall as if they were alive. And they are, in a way, because it is thousands of investors who wax and wane on the price of some quality in a company, and tumble up or tumble down as they race for the stairs or the exit in an opportunistic bid to be there first.
Other than that and the price of risk which is arguably the stock price and doesn’t wax and wane or bobble-about, we don’t know anything about stock prices and certainly not anything that could be discovered with a ruler, a compass and a magnifying glass.
However, there are many stock-watchers who think that there’s money to be made by watching the daily and intra-daily trend of bid and ask prices and confirming volumes. And there is, but that’s just sex. Where’s the love?
To find the love, we looked at it from our point of view and, interestingly enough, we found that a portfolio of six of these so-called “breakout” stocks found with a ruler and compass and selected at random from the dozens that show up every day but managed as a Perpetual Bond™, is up +82% so far this year and up a staggering +272% since December 2012, a year ago. That bears some watching because we don’t believe in “riskless love”. Please see the fundamentals below.
Exhibit 1: The Broken-Down Breakout Stocks – Fundamentals – February 2014
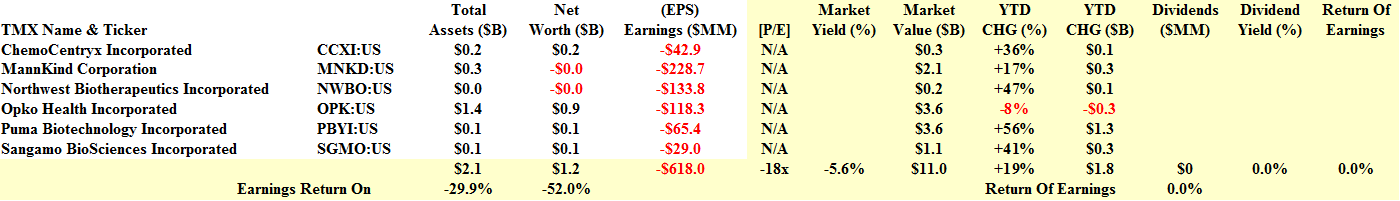
The Broken-Down Breakout Stocks – Fundamentals – February 2014

The Broken-Down Breakout Stocks – Risk Price Chart – February 2014
It would easy for a normal investor to miss these stocks; the aggregate market value is only $11 billion – they are “micro-caps” – and the net worth is about half of their total assets – they can barely get debt financing – and their losses were without exception and totalled $618 million last year; and they don’t pay dividends.
Nevertheless, the aggregate market value of all six of them is up +115% and $4.9 billion since December 2012 and a further +19% and $1.8 billion since December last year.
They did even better when managed as a Perpetual Bond™ which is a “no risk” instrument and four of them are in there now. Please see Exhibit 2 and 3 below for the details.
Exhibit 2: (B)(N) The Broken-Down Breakout Stocks – Prices & Portfolio – February 2014

The Broken-Down Breakout Stocks – Prices & Portfolio – February 2014
Exhibit 3: (B)(N) The Broken-Down Breakout Stocks – Portfolio & Cash Flow Summary – February 2014

The Broken-Down Breakout Stocks – Portfolio & Cash Flow Summary – February 2014
(Please Click of the Charts to “magnify” them and again if required.)
However, we missed a lot of the action in NWBO Northwest Biotherapeutics Incorporated (The Street, January 17, 2014, 5 Stocks Ready to Break Out) at $4 last year and at $22 three years ago (please see the charts below) but we’re ready to buy it now at $6 which is above the “price of risk” which we estimate as the Risk Price (SF) and which is $5.75 and steady but with the usual safeguards which in this case is a stop/loss at $5.50 which would also put it below the price of risk. It’s definitely tight and our estimate of the downside in the portfolio of all six of them in the next quarter due to the demonstrated volatility is minus (24%) should all of love’s labour be lost.
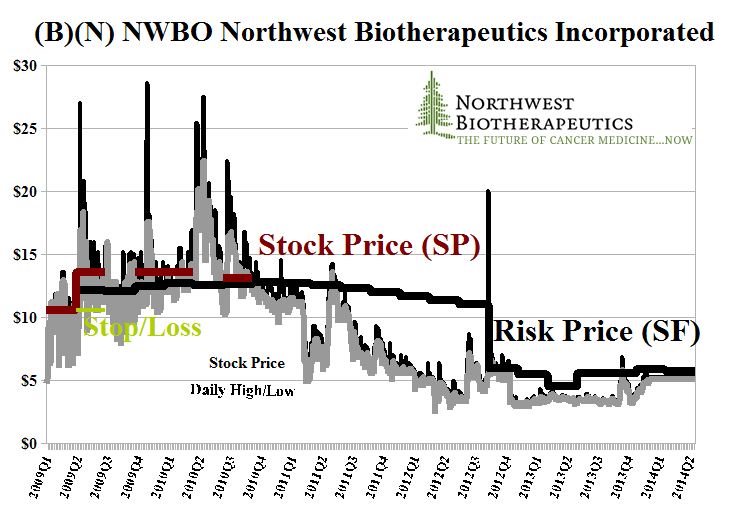 (B)(N) NWBO Northwest Biotherapeutics Incorporated |
 NWBO Northwest Biotherapeutics Incorporated – February 2014 |

NWBO Northwest Therapeutics Incorporated
Courtesy: StockCharts
Moreover, today’s chart looks eerily familiar to one that we saw in March 2010.
For more information on “risk management” and additional references to the theory, please see our recent Post, The RiskWerk Company Glossary.
And for more on what risk averse investing has done for us this year, please see our recent Posts on The S&P TSX “Hangdog” Market or The Wall Street Put or specialty markets such as The Dow Transports & Utilities or (B)(N) The Woods Are Burning, or for the real class action, La Dolce Vita – Let’s Do Prada! and It’s For You, Dear on the smartphone business.
And for more stocks at high prices, The World’s Most Talked About Stocks or Earnings Don’t Matter – NASDAQ 100. And for more on what’s Working in America, Big Oil, Shopping in America or Banking in America, to name just a few.
Postscript
We are The RiskWerk Company and care not a jot for mutual funds, hedge funds, “alternative investments”, the “risk/reward equation” and every other unprovable artifact of investment lore. We have just one product
The Perpetual Bond™
Alpha-smart with 100% Capital Safety and 100% Liquidity
Guaranteed
With No Fees and No Loads on Capital
For more information on RiskWerk, please follow the Tags or Categories attached to this Letter or simply enter Search for additional references to any term that we have used. Related data may be obtained from us for free in a machine readable format by request to RiskWerk@gmail.com.
Disclaimer
Investing in the bond and stock markets has become a highly regulated and litigious industry but despite that, there remains only one effective rule and that is caveat emptor or “buyer beware”. Nothing that we say should be construed by any person as advice or a recommendation to buy, sell, hold or avoid the common stock or bonds of any public company at any time for any purpose. That is the law and we fully support and respect that law and regulation in every jurisdiction without exception and without qualification to the best of our knowledge and ability. We can only tell you what we do and why we do it or have done it and we know nothing at all about the future or the future of stock prices of any company nor why they are what they are, now. The author retains all copyrights to his works in this blog and on this website. The Perpetual Bond®™ is a registered trademark and patented technology of The RiskWerk Company and RiskWerk Limited (“Company”) . The Canada Pension Bond®™ and The Medina Bond®™ are registered trademarks or trademarks of the Company as are the words and phrases “Alpha-smart”, “100% Capital Safety”, “100% Liquidity”, ”price of risk”, “risk price”, and the symbols “(B)”, “(N)” and N*.
