(B)(N) Stock Prices Are The New Pink

CME Chicago Mercantile Exchange Today
Drama. It might surprise you that economists don’t know what a “stock price” is. They can tell us what the prices of stocks are but so can everybody else. But can they tell us why they are what they are?
For example, if we gave them a basketful of positive numbers that are all the “stock prices” of just one company for one day, a week or a month, could they tell us whether the company is “fairly valued”, “overvalued” or “undervalued”?
The answer could be the median value of all the demonstrated prices; or the average value assuming that the traded volumes were comparable; or if we had the volumes of each trade, then we could compute the volume-weighted average price although we would be inclined to take the price of the median of the market values so traded (and therefore demonstrating a balance of supply and demand at that price).
In other words, they don’t know the answer because they don’t know what a stock price is and so develop an impressive pseudo-mathematical cum ad hoc statistical method to tell us what the “fair value” is. And if we gave them the volumes and prices for today’s basket of stock prices for CME Group Incorporated as above, they would have to conclude that the “fair value” is $80 today but might be something else tomorrow. Nor does it help to have an even bigger basket of the stock prices.
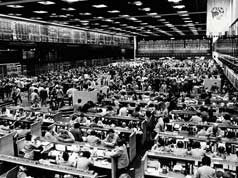
Octagonal Trading Desks circa 1919
Courtesy: CME Group Incorporated
But the market says that the “fair value” is $71 (Morningstar) so why is this stock trading for $80?
Is it due to “irrational exuberance”; or an “inefficient market”; or is it due to a series of familiar and time-worn “pseudo-ownership” calculations that suggest that $80 is a good price for 30× earnings [P/E] for a nominal market price yield of 3.3% and a dividend yield of 3.7% even though the stock price is already up +65% this year?
Our approach to these questions is quite different (please see below) and also conclusive because we know what a stock price is and, therefore, we can also know whether it’s “fairly valued”, “overvalued” or “undervalued”.
Exhibit 1: (B)(N) CME CME Group Incorporated – Risk Price Chart

(B)(N) CME CME Group Incorporated
For example, the CME Group is the world’s largest options trading bench and it trades about three billion options contracts with an average total value of about $1,000 trillion a year or roughly ten times the combined market value of every stock market in the world.
The current market value of the company is about $30 billion and for all its activity it earned about $1 billion and paid about $600 million in dividends to its shareholders for a payout rate of 60% which is up significantly from 20% three years ago and not a bad return for an “owner”.
But we’re portfolio investors and this is just one of hundreds of companies with little in common of which we know less, least of all their P/Es and expected dividend yields and payout rates. If we ran our portfolio on the basis of 3% dividend yields and 3% price yields, then we should get +6% per year, year-in and year-out.
Alquimist Barcelona
+6% Every Year
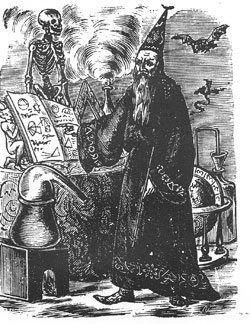
But the problem is the “3% price yield” part – it might be minus(-20%) or worse, sometimes, for example, and although it’s only a “paper loss”, it seems that a lot of investors are compelled to sell at a loss, so much so that investors who are making +6% or more a year on their investments, year after year, become legends and are deemed to be wizards.
To avoid that trap which seems all too common, we need to think about “undervalued” and “overvalued” in a different way.
We can say that a company is “undervalued” at the current stock price if there is an excess of demand over supply for the stock at that price or higher meaning that we can’t buy it for less because nobody will sell it to us for less absent some pressing need for liquidity or other inspiration.
And similarly, a company is “overvalued” at the current stock price if there is an excess of supply over demand for the stock at that price or less meaning that it’s fairly easy to find sellers at the current price who might even take a lower price should it be offered but are not particularly conflicted should a higher price be offered.
If the terms “undervalued” and “overvalued” are to have an actionable meaning to investors, then those are the symptoms. They are necessary conditions but do not necessarily have any meaning for the company and how its doing or will do or how much of it we might own or control.
But they are not sufficient because there are many reasons for no excess demand for a “good stock” and excess demand for a well-supplied possibly “bad one”.
However, we can say that there is “a least stock price at which a company is likeable” (Goetze 2006) meaning not that it might have some “likeable” accounting perquisites attractive to “owners” but that it is neither “undervalued” nor “overvalued” in the above sense. In other words, it is “fairly valued” and we can show that price is the “price of risk“.

The Nash Equilibrium
Stock Prices Are The New Pink
Moreover, in this context of economics, because “supply” meets “demand”, the price of risk is “the” stock price in terms of its properties and, again, that has nothing to do with “ownership” of the company because our only interest is that the stock might pay dividends pro rata the owners, a “right” that is protected by law, and we might be able to timely sell the stock for more than what we paid for it, an opportunity that might be denied the “owners”.
In the case of the CME Group above, we did not own the stock in the “overvalued zone” (or “trading zone” (N)) trading below the price of risk but started buying it at $60 last year in the “undervalued zone” (B) and have held it ever since, protecting our prices with effective stop/loss sales (and repurchases at lower prices) as necessary.
Obviously, there’s a lot of money on the table for investors who bought the stock at $40 to $50 but the stock was not recognized as “undervalued” until its price breached the price of risk at $60 last year. And it’s still “undervalued” at $80 but whether it keeps that stock price or not depends on factors that are not within our control or understanding. Our estimate of the downside in the stock price due to the demonstrated volatility is minus ($9) per share so that it could be trading between the current $80 and $70 to $90 without surprise.
Please see our recent Post, (B)(N) The “Undervalued” Equity Markets, to see how this works out for the entire market.
And for more information and additional references to the theory, please see our recent Post, The RiskWerk Company Glossary.
And for more on what risk averse investing has done for us this year, please see our recent Posts on The S&P TSX “Hangdog” Market or The Wall Street Put or specialty markets such as The Dow Transports & Utilities or (B)(N) The Woods Are Burning, or for the real class action, La Dolce Vita – Let’s Do Prada! and It’s For You, Dear on the smartphone business.
And for more stocks at high prices, The World’s Most Talked About Stocks or Earnings Don’t Matter – NASDAQ 100.
And for more on what’s Working in America, Big Oil, Shopping in America or Banking in America, to name just a few.
Postscript
We are The RiskWerk Company and care not a jot for mutual funds, hedge funds, “alternative investments”, the “risk/reward equation” and every other unprovable artifact of investment lore. We have just one product
The Perpetual Bond™
Alpha-smart with 100% Capital Safety and 100% Liquidity
Guaranteed
With No Fees and No Loads on Capital
For more information on RiskWerk, please follow the Tags or Categories attached to this Letter or simply enter Search for additional references to any term that we have used. Related data may be obtained from us for free in a machine readable format by request to RiskWerk@gmail.com.
Disclaimer
Investing in the bond and stock markets has become a highly regulated and litigious industry but despite that, there remains only one effective rule and that is caveat emptor or “buyer beware”. Nothing that we say should be construed by any person as advice or a recommendation to buy, sell, hold or avoid the common stock or bonds of any public company at any time for any purpose. That is the law and we fully support and respect that law and regulation in every jurisdiction without exception and without qualification to the best of our knowledge and ability. We can only tell you what we do and why we do it or have done it and we know nothing at all about the future or the future of stock prices of any company nor why they are what they are, now. The author retains all copyrights to his works in this blog and on this website. The Perpetual Bond®™ is a registered trademark and patented technology of The RiskWerk Company and RiskWerk Limited (“Company”) . The Canada Pension Bond®™ and The Medina Bond®™ are registered trademarks or trademarks of the Company as are the words and phrases “Alpha-smart”, “100% Capital Safety”, “100% Liquidity”, ”price of risk”, “risk price”, and the symbols “(B)”, “(N)” and N*.
