Diversification For The Masses
Drama. “Diversification” is an investment practice that doesn’t have any legs – it walks and talks, but it won’t get us to where we want to go. We want our investments to be “as good as cash” and “better than money”, and for that we need to know more about the investments and not just the past relationship of a bunch of numbers – returns or stock prices – that have no provable relationship to our goal – that is, we want our investments to be “as good as cash” and “better than money”. Anything else is just a gamble.

As Good As Cash and Better Than Money, or It’s A Failure
We’re not suggesting, of course, that we should have only one stock – unless it’s the one that is going to go up the most in the shortest time, such as today, and there’s one of those every day – but we would have no problem holding just one stock, any stock, if we knew that the investment was “as good as cash” and “better than money” and it would be nice if it paid a dividend, too, while we are waiting for the price to go up, and are not worried at all that the price might go down, using our usual price protections of a stop/loss or “collar”. Please see almost any of the (B)(N)-Company posts.

Diversification & The Efficient Frontier
Really Bizarre
On the other hand, if all we have is “diversification” then our hopes for the future are constrained by dependence on past “volatility” and the simple and minimal relationship that all of diversification practice and Modern Portfolio Theory (MPT) depend on, and that’s all that they have, absent the really bizarre notion of mean-variance efficiency:
Var(X+Y) = Var(X) + Var(Y) + 2×Cov(X,Y).
This relationship is true (and very interesting from a mathematical point of view) for any series of numbers (X) and (Y) of the same length, and for any number of them, because it’s an arithmetic relationship. That is, if the algebra is true, then so is this because (X + Y)² = X² + Y² + 2×XY.

A Fully Diversified Portfolio
Courtesy: Lehman Brothers & Barclays Bank PLC.
Neither of whom have demonstrated a policy of appropriate diversification.
But there is no algebra of stock prices or returns – they don’t add up, for example – and we’re entirely comfortable (although dismayed – please see below) with the assertion that tens of thousands of research papers on this equation and it’s consequences in investment practice, contribute nothing to what we want – that our investment should be “as good as cash” and “better than money”.
The Street has recently answered some questions from small investors – those who have only five stocks, as an example – about whether they are properly diversified (The Street, June 26, 2013, Cramer’s ‘Mad Money’ Recap: Stick With What Works) and the following three portfolios were deemed to be properly diversified after some adjustments.
The first portfolio included Laredo Petroleum (LPI), Ford Motor (F), BlackBerry (BBRY), Groupon (GRPN), and CVS Caremark (CVS); the second portfolio’s top five holdings included: General Electric (GE), Duke Energy (DUK), Trinity Industries (TRN), DTE Energy Holding Company (DTE), and Microsoft (MSFT); and the third portfolio had Walt Disney (DIS), Coca-Cola (KO), Enterprise Product Partners (EPD), American Express Company (APX), and Wells Fargo (WFC) as its top five stocks.
Mr. Cramer said that the first portfolio is adequately diversified, but in the second portfolio, Duke Energy and DTE were in the same business, and he advised selling DTE and adding a drug stock such as Bristol-Myers Squibb (BMY); and, similarly, in the third portfolio, American Express and Wells Fargo are both city-banks, and he advised selling Amex and buying Bristol-Myers instead.
Based on the Risk Price Chart (please see Exhibit 1 and 2 below), we would have kept DTE, and sold Duke Energy, instead, because the latter has an estimated downside volatility of its stock price of minus ($3.50) per share and would trade below the price of risk, Risk Price (SF), which is $67 and flat, and we would not be surprised by any price between the current $66 and $63 or $70, absent some new information.
Duke Energy is also expected to pay a dividend of $0.77 per share per quarter, or $2.2 billion to its shareholders this year, for an extraordinary current yield of 4.7% which might be handy when our total debt is $73 billion and nearly twice our net worth of $41 billion and exceeds the current market value of $47 billion, too.
DTE Energy is similarly aggressively geared (total debt $18 billion, shareholders equity $7.5 billion, and market value $12 billion, also at $67 per share) but is trading well-above the current Risk Price (SF) of $53 and rising. Our estimate of the downside volatility in the stock price is also minus ($3.50) but we can obtain purposeful price protection with a free stop/loss at $64, or a collar with a low net cost that can be paid for from some of our profits. DTE Energy is expected to pay a current dividend of $0.66 per share per quarter for a total of $460 million and a current yield of 3.9%.
So, what is the company with the stock price or expected return, X+Y, for X=Duke Energy and Y=DTE Energy? In fact, when we consider the paradigm above, the volatility of X+Y is the same as each of them when considered as a “white noise” (which is minus ($3.50) or 5% per share for each of them) and that just doesn’t add up (please see below) and they are not even trading in the same currency because Duke Energy is trading at the risk price, but DTE Energy is trading at a +25% premium to the risk price. Please see Exhibit 1 and 2 below.
We also note that the Sharpe Ratios are the same if we’re expecting similar price returns (please see Exhibit 1 and 2 below), and in that case, too, nothing adds up unless the returns or prices are maximally negatively correlated; that is, Cov(X,Y) = -Var(X) or -Var(Y) and so, Var(X+Y) ≈ 0, and we conclude that a “white noise” plus a similar “white noise” is still just a “white noise” and not two of them or “a twice as loud double hiss” even though the “stock price” of X+Y is twice as much (but they don’t change together because Duke Energy is four times as large as DTE Energy by market value).
On the other hand, we can add them up on the basis of the price of risk if we note that DTE is trading at a +25% ($67/$53) premium, but Duke Energy is trading at a 1% discount to the price of risk ($66/$67); in other words, we might expect that $1 of DTE stock today will buy $1.25 or more of Duke Energy “as good as cash” at the price of risk in the future as well as now absent some new information.
Exhibit 1: (B)(N) DTE DTE Energy Holding Company – Risk Price Chart

(B)(N) DTE DTE Energy Holding Company
DTE Energy Holding Company is engaged in the business of providing electricity and natural gas sales, distribution and storage services throughout southeastern Michigan.
(Please Click on the Chart to make it larger if required.)
Exhibit 2: (B)(N) DUK Duke Energy Corporation – Risk Price Chart

(B)(N) DUK Duke Energy Corporation
Duke Energy Corporation is an energy company. Its regulated utility operations serve 4 million customers located in five states in the Southeast and Midwest United States, representing a population of approximately 12 million people.
(Please Click on the Chart to make it larger if required.)
Similarly, we can consider American Express and Wells Fargo, and we could take them both based on the price of risk. American Express at $65 has a current dividend yield of 1.3% and Wells Fargo at $40 has a current dividend yield of 3% and will pay $6.4 billion to its shareholders this year, in contrast to American Express that is expected to pay about $900 million. or much less, and has total assets of $153 billion or 1/10th of those of Wells Fargo.
If each of these portfolios is then properly diversified, then we can combine them to get another portfolio that is also properly diversified. Moreover, we can run the portfolio of fourteen companies (counting Bristol-Myers only once) as a Perpetual Bond™ (Portfolio and Total lines in Exhibit 3) or just a buy and hold portfolio of all the companies (Companies line) since September of last year. Please see Exhibit 3 and 4 below.
Exhibit 3: A Properly Diversified Portfolio – Cash Flow ($000)
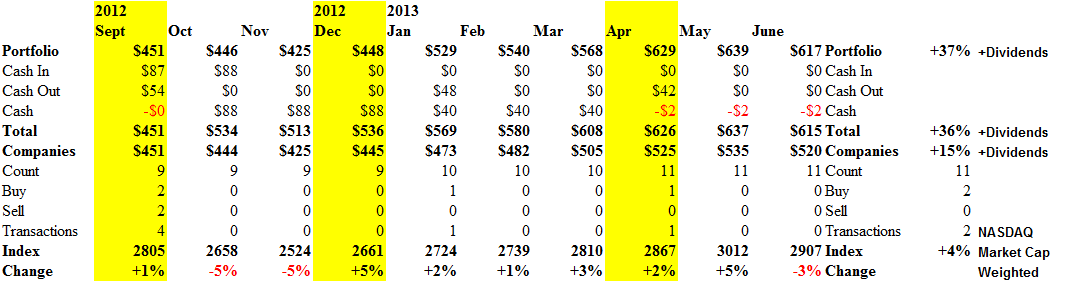
A Properly Diversified Portfolio – Cash Flow ($000)
(Please Click on the Chart to make it larger if required.)
Exhibit 4: A Properly Diversified Portfolio – Portfolio ($000)

A Properly Diversified Portfolio – Portfolio ($000)
(Please Click on the Chart to make it larger and again if required.)
It’s noteworthy that we bought only nine of the fourteen companies in September of last year and in order to spend the same amount of money on each portfolio, whether all the fourteen companies or just the nine in the Perpetual Bond™ (B) at that time, we had to overweight the latter by 30% based on their prices (please see Exhibit 4 above).
We’ve never owned Laredo (+10% since December), Research in Motion (+28%), or Groupon (+55% since December), and we sold both Microsoft and Coca-Cola in October but bought them again later. Please see Exhibit 4.
Nevertheless, the Perpetual Bond™ gave us more of what we want; for example, +36% plus dividends in ten months and we were never under water. Please see Exhibit 3 (Total line). Whereas the all companies portfolio (Companies line) had some problems keeping its feet dry, so to speak, and what is one to do if we are already properly diversified?
The calculated Risk Price (SF) is a provably effective estimate of the “price of risk” which is “the least stock price at which the company is likeable” (Goetze 2006) and “likeability” is determined by the demonstrated factors of “risk aversion” – we want to keep our money and obtain a hopeful return above the rate of inflation – and the properties of portfolios of such stocks. Stock prices that are less than the price of risk can be said to be “bargain prices” but with the risk attached that the company might never get a higher price other than that due to ambient volatility or “surprise”; on the other hand, investors who are willing to pay the “full price” above the price of risk, and buy and hold the stock at those prices, must also be confident, and have reason to believe, that the company will produce those values, absent new information.
Please see our Posts, The Price of Risk, August 2012 and The Nash Equilibrium & Its Stock Price, October 2012, for more information on the theory.
To see what else “risk averse” investing can do for us, please see our recent Posts, The Wall Street Put, April 2013, and earlier Posts such as The Dow Transports, March 2013, or The Risk Adjusted Dow, March 2013, or The Canada Pension Bond, February 2013, and for a more colorful description of investment risk and the application of the “price of risk” to mergers & acquisitions, please see our Post, Bystanders & Collateral Damage, April 2013.
Postscript
We are The RiskWerk Company and care not a jot for mutual funds, hedge funds, “alternative investments”, the “risk/reward equation” and every other unprovable artifact of investment lore. We have just one product
The Perpetual Bond™“
Alpha-smart with 100% Capital Safety and 100% Liquidity”
Guaranteed
With No Fees and No Loads on Capital
For more information on RiskWerk, please follow the Tags or Categories attached to this Letter or simply enter Search for additional references to any term that we have used. Related data may be obtained from us for free in a machine readable format by request to RiskWerk@gmail.com.Disclaimer Investing in the bond and stock markets has become a highly regulated and litigious industry but despite that, there remains only one effective rule and that is caveat emptor or “buyer beware”. Nothing that we say should be construed by any person as advice or a recommendation to buy, sell, hold or avoid the common stock or bonds of any public company at any time for any purpose. That is the law and we fully support and respect that law and regulation in every jurisdiction without exception and without qualification to the best of our knowledge and ability. We can only tell you what we do and why we do it or have done it and we know nothing at all about the future or the future of stock prices of any company nor why they are what they are, now. The author retains all copyrights to his works in this blog and on this website. The Perpetual Bond®™ is a registered trademark and patented technology of The RiskWerk Company and RiskWerk Limited (“Company”) . The Canada Pension Bond®™ and The Medina Bond®™ are registered trademarks or trademarks of the Company as are the words and phrases “Alpha-smart”, “100% Capital Safety”, “100% Liquidity”, ”price of risk”, “risk price”, and the symbols “(B)”, “(N)” and N*.
