(P&I) Inflation & The Limits To Growth

The Economy With “Spin” Control
Essay. The Theory of the Firm tells us what the future will be if we keep on doing what we’re doing now; the only things that we can control are the uptake rate; and, secondly, knowing what we know, will we change what we do (and repent) or will we keep on doing the things that we’re doing now?
Nevertheless, it’s not easy to”turn” an “economy” one way or another and when we say that “we know what the future will be”, what we are really saying is that we know what the “potential” is for the current economy and, therefore, what is its deficiency which provides us with choices that we can make.
To briefly review, we showed in The Process that the economy admits of only four “companies” that are qualitatively different and which are defined (exactly) by their “modality” α=R/P where R is “what is owed to us” and P is “what we owe”; the companies are Company A (0<α<1/e, where “e” is the exponential), Company B (1/e<α≤1), Company C (α>1) and Company D (α=1/e) which we have called the “Death Embrace” for reasons that we explained in The Process and The Process End-Of-Process.
In The Theory of Firm, we developed the concept of the “working capital” (W) which is an “operator” in the “float space” (N) of receivables and payables that are developed in an economy; and we showed that there is a “common capital” (W)×(1-W) that is “created” in the float space between the company and its “trading connections” and, in this context, the economy is its trading connections which includes every thing and every person and every organization and process in it; and we showed that the development of (W) depends exactly on “the demonstrated societal standards of risk aversion and bargaining practice” (the “N/B/W”-Financing Model) within that economy; moreover, by means of the “projection operator” (1-δ), we showed how to calculate these quantities in the familiar measures of the “balance sheet” Total Assets = Shareholders Equity (N) + Total Liabilities (P).

Are you the one?
Naturally, we are once again concerned with the “unit” (1) which represents the current “company” or “economy” as it is.
The growth of the unit is determined by (W) as (1*) = (1)/((1)-(W)) = (1) + (W) + (W)² + (W)³ + … and so on in an “iterative”-process that “works” the “working capital” between the “beginning of process” and “the end-of-process” and where we have used the parenthesis “( )” to emphasize that these are not multiplications and additions of scalar-quantities but transformations on the embedding-space and σ-algebra (N) that is developed in The Process; and we also emphasize that these results are due to merely counting – a nearly universal skill – and the necessity of a conservation law such as that of the balance sheet that defines the modality; they don’t require advanced mathematics or economics or even accounting which makes them all the more cogent.
In particular, the future of the net worth (N) is (N*) = (N)/((1)-(W)) and the difference between the “future” and now is (N*) – (N) = (N)/((1)-(W)) – (N) = (N)×(W)/((1)-(W)) = (GW*)×(N) where GW* is the “Coase Dividend” and defines the percentage growth of (N) to (N*) in this case, all of which can be valued in real terms by the use of the projection operator (1-δ); please The Theory of the Firm for an example, although we will also develop these values for the Dow Jones Industrial Companies, in aggregate, as an example of an “economy”.
Inflation
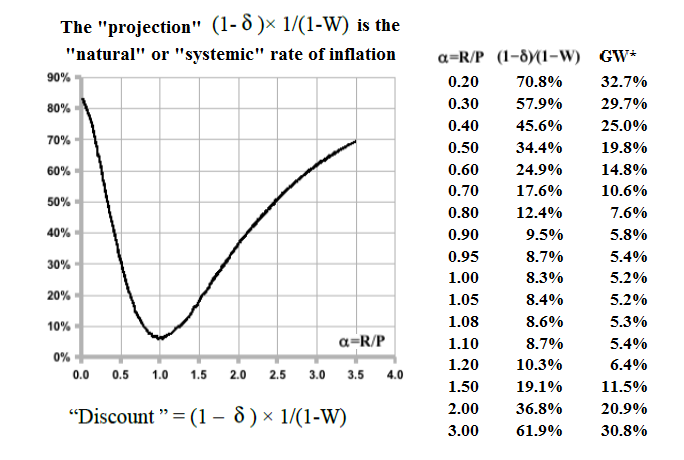
Figure 1: Inflation
One of the consequences of this is that “inflation” is defined by the working capital operator as (1)/((1) -(W)) and we can “project” its value into the “real world” as (1-δ)×(1)/((1) -(W)) = (1+log(1-W))×(1/(1-W)) where the latter are just numbers derived from the theory of the firm and which depend only on the demonstrated modality; please see Figure 1 on the right.
These numbers appear to be astounding (even dangerous if one of these is our economy) but what they say is that if we keep on doing what we’re doing, then the “worth” of our currency today will decline by those amounts; on the other hand, the “uptake” rate is up to us so we don’t really know when they will decline.
For example, the expected “inflation” in a modern economy that is operating at a modality of α=1.5 (Company C) is +19.1%; what that means is that if we “control” price-inflation as measured by a broad index such as Consumer Price Inflation (CPI) and we keep on doing what we’re doing, then the purchasing power of our real dollar will decline by 19%; we can only control when so if we “keep” the observed price inflation at 2%, for example, then it will take 9 years (8.8=log(1+0.19)/log(1+0.02)) before everything that we buy costs 20% more and there’s nothing that we can do about it if we keep on doing what we’re doing.
The same can be said if our economy is “deflationary” and our “cash” seems able to buy more; the problem is that eventually our cash will only be able to buy less, 19% less, if we keep on doing what we’re doing; similarly, in the case of hyperinflation, our “cash” might not be able to buy anything, even tomorrow, but if – somehow – we are able to maintain our modality, by choice or not, eventually we’ll be able to buy something at only 19% more than what we might pay for it today (before hyperinflation).
The Food Chain
These “numbers” are also impressive for Company A modalities α<1/e such as α=0.30 (58%) or super-high modalities for a Company C (α>1) such as α=3 (62%) (for more on this, please see our Post The Food Chain); and they are meaningful in gauging “natural” or systemic forces that will affect currency exchange rates.
For example, investing in the real assets of a country that is currently discounted at 70% (Company A with modality α=0.3) is a better bet than investing in a country with a lower discount rate such as Company C with α=1.2 and a discount of only 10%; but, obviously, not all the problems of a currency are economic and the measures don’t predict when that might happen even if the modality – which is exactly created by the “societal standards of risk aversion and bargaining practice” – doesn’t change.
The Limits To Growth
The expected percentage increase in the net worth of a company or country is measured by GW*, the “Coase Dividend” (so-named by the author); as above (please see Figure 1), [(N*)-(N)]/(N) = (W)/((1)-(W)) = (GW*) which can be described as the result of “working” the “working capital”; we also note that we can write [(1*)-(1)]/(1) = (GW*) and that expression is meaningful in The Theory of the Firm.
For example, a developed industrial economy with modality 0.90<α<1.10 (please see Figure 1 above) can only expect to increase the size of the current “float space” by about 6% without a change in its modality; whereas a Company A modality such as α=0.30 or a Company C modality with α=3 can expect to “grow” the “float space” according to its current practices by +30% without a change in its modality; and that will be always true so that GW* is an inverse measure of “effectiveness” in establishing credit relations among the trading connections; the higher the number, the less the current “effectiveness” but the greater the possibilities.
For example, the Dow Jones Industrial Companies have a current demonstrated modality of α=1.25 (please see Exhibit 1 below) which means that even at the current elevated prices which are up $865 billion and +23% last year but 0% so far this year, they are still 7% percent undervalued (please see GW* in Figure 1 above) and they will always be undervalued no matter when we buy them or what we are willing to pay for them because their future is always a guaranteed +7% for as long as things don’t change too much – and that’s the guarantee for which we don’t need fifty-years of history and statistics to unravel.
Exhibit 1: The Dow Jones Industrial Companies – Fundamentals – April 2014
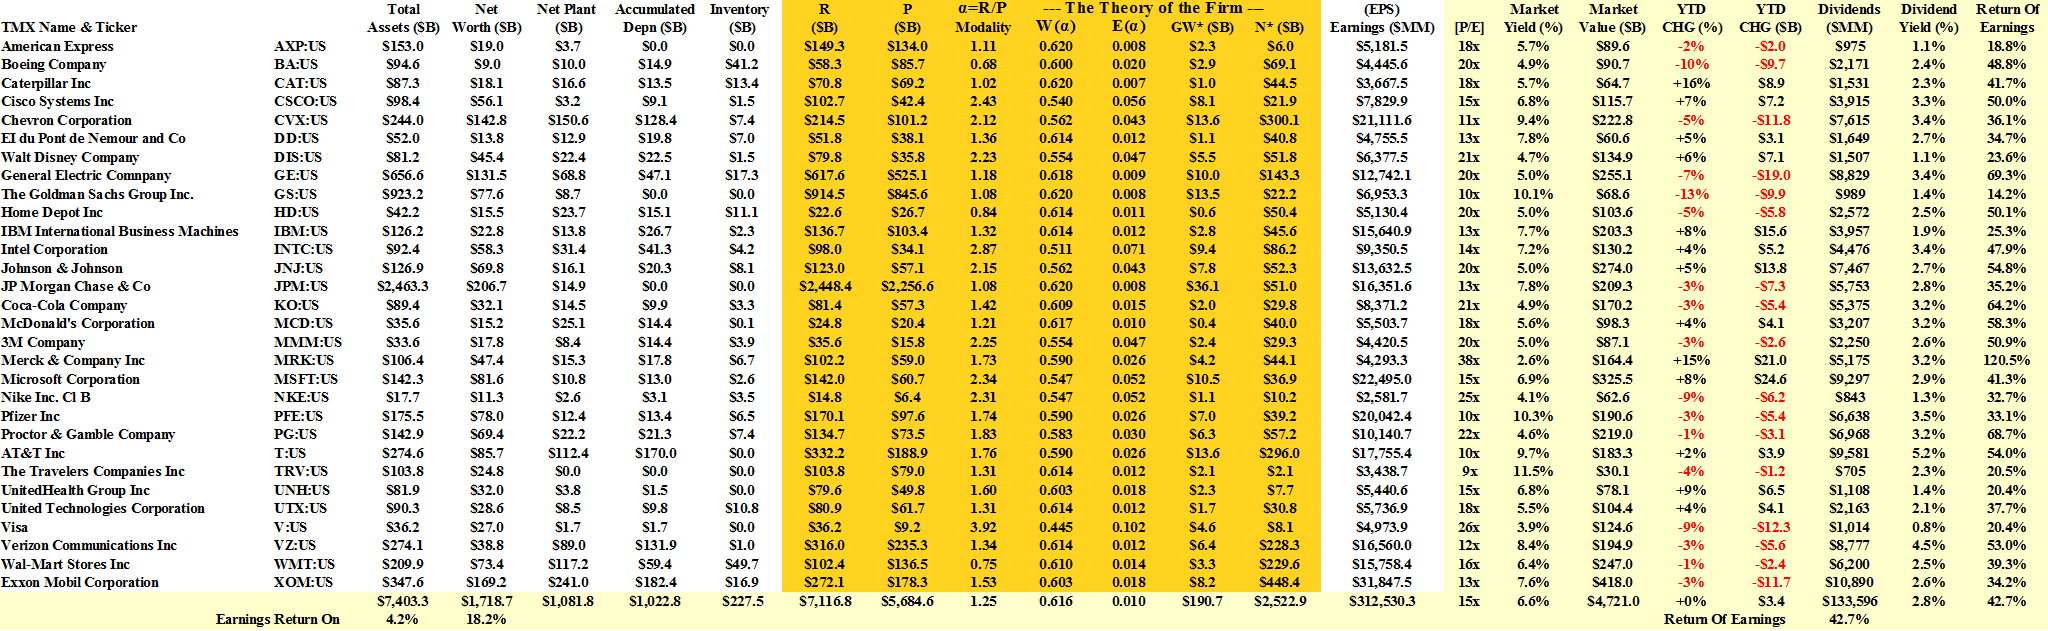
The Dow Jones Industrial Companies – Fundamentals – April 2014

(B)(N) The “Undervalued” Dow Jones Industrial Companies – Risk Price Chart – April 2014
With reference to Exhibit 1, the thirty Dow Jones Industrial Companies are currently “valued” at $4.7 trillion with total assets of $7.4 trillion and a net worth of $1.7 trillion.
The Coase Dividend (GW*) is $190 billion and N* is $2.5 trillion or 50% more than the current net worth (N); the [P/E]-multiple is 15× for a market price yield of 6.6% and the aggregate dividend yield is 2.8% for a return of earnings of 43% to the shareholders.

The Coase Dividend
The Coase Dividend is the most valuable asset that these companies have and investors are willing to pay nearly $25 for $1 of it ($4.7 trillion/$190 billion) unlike the “accounting assets” which are getting only $1.50 these days and we might compare it to an excretion similar to the whale ambergris in its day.
For more applications of these concepts please see our Posts which rely on the Theory of the Firm developed by the author (Goetze 2006) which calibrates The Process to the units of the balance sheet and demonstrates the price of risk as the solution to a Nash Equilibrium between “risk-seeking” and “risk-averse” investors within the societal norms of risk aversion and bargaining practice.
And for more on The Process, please see our Posts The Food Chain and The Process End-Of-Process.
Postscript
We are The RiskWerk Company and care not a jot for mutual funds, hedge funds, “alternative investments”, the “risk/reward equation” and every other unprovable artifact of investment lore. We have just one product
The Perpetual Bond™
Alpha-smart with 100% Capital Safety and 100% Liquidity
Guaranteed
With No Fees and No Loads on Capital
For more information on RiskWerk, please follow the Tags or Categories attached to this Letter or simply enter Search for additional references to any term that we have used. Related data may be obtained from us for free in a machine readable format by request to RiskWerk@gmail.com.
Disclaimer
Investing in the bond and stock markets has become a highly regulated and litigious industry but despite that, there remains only one effective rule and that is caveat emptor or “buyer beware”. Nothing that we say should be construed by any person as advice or a recommendation to buy, sell, hold or avoid the common stock or bonds of any public company at any time for any purpose. That is the law and we fully support and respect that law and regulation in every jurisdiction without exception and without qualification to the best of our knowledge and ability. We can only tell you what we do and why we do it or have done it and we know nothing at all about the future or the future of stock prices of any company nor why they are what they are, now. The author retains all copyrights to his works in this blog and on this website. The Perpetual Bond®™ is a registered trademark and patented technology of The RiskWerk Company and RiskWerk Limited (“Company”) . The Canada Pension Bond®™ and The Medina Bond®™ are registered trademarks or trademarks of the Company as are the words and phrases “Alpha-smart”, “100% Capital Safety”, “100% Liquidity”, ”price of risk”, “risk price”, and the symbols “(B)”, “(N)” and N*.
