(B)(N) NEM Newmont Mining Corporation

The “cost of risk”
$30 billion
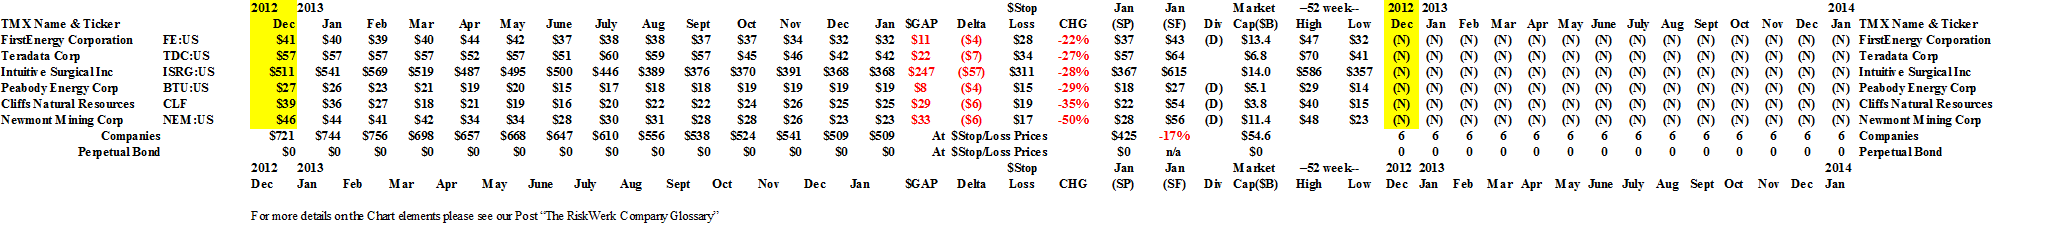
Drama. Although the market was up more than +27% last year, only about half of the companies in the S&P 500 made that mark and among the biggest losers were FirstEnergy Corporation (-22%), Intuitive Surgical Incorporated (-28%), Peabody Energy Corporation (-29%), Teradata Corporation (-33%), Cliffs Natural Resources (-35%) and the winner in the race for the bottom is one of the world’s largest gold and copper producers Newmont Mining Corporation (-50%).
But what’s really interesting, however, is that it took investors nearly three years to discover that there might a problem in selling the stock at a higher price – that is, that it was “overvalued” – and the stock traded an average of 9 million shares a day, every day for the entire year as the stock price plunged from $45 to $23.
And for every seller, there has to be a buyer and if the price is low enough, the buyer of last resort could be the company itself (if it still has money) or the new owner. Please see Exhibit 4 below.
These six companies have a current combined market value of $55 billion but they lost $30 billion in market value last year; showed negative earnings of minus ($1.9 billion) and still paid dividends of $1.5 billion for a current dividend yield of 2.7%.
Exhibit 1: Six of the S&P 500 “Overvalued” Companies – Fundamentals

S&P 500 Overvalued – Fundamentals
How can an investor possibly understand this?
The “cost of risk” is
$30 billion if we don’t know the “price of risk”.
A “value analyst” might say anything such as “these companies are now good value” or “we expected that there would be losses or weak earnings” or a “macro analyst” might say that commodities such as gold, silver, copper and coal are simply not needed at the present time so we should not be surprised that FirstEnergy, Peabody Energy, Cliffs Natural Resources or the Newmont Mining Corporation did not get their “fair share” of “wild” or “exuberant” price appreciation last year.
But what about the future?
We can’t buy any of these companies right now because they are all trading at prices below the “price of risk” and, in addition, our estimate of the downside in the stock prices due to the demonstrated volatility is minus (17%).
Moreover, for the same reason – that they are “overvalued” – we haven’t owned any of them all last year (in 2013). Please see Exhibit 2 below.
Exhibit 2: S&P 500 Overvalued – Prices & Portfolio – January 2014
S&P 500 Overvalued – Prices & Portfolio – January 2014
Grenzuberschreitungen in Franz Kafkas Amerika
In our view, all of these stocks are still overvalued because there is insufficient investor demand to buy them at these prices.
In our view, “investing” is not about a mad dash for the finish line and “squatter’s rights” or that we need to be “smarter” or there first.
As investors and not owners, we need to buy what people want but if we don’t know that, a fast (smart) horse is only of marginal help.
In December of 2012, there were 165 companies in the S&P 500 that were “overvalued” in that sense and their combined market value was $3.9 trillion but their combined “price of risk” was much higher at $4.8 trillion. Similarly, in December of 2012, there were 335 companies in the S&P 500 that were “undervalued” and their combined market value was $9.9 trillion which exceeded their combined “price of risk” which was $9.3 trillion and there was less than a 5% difference between the two “valuations”.
But the results were quite different. Please see Exhibit 3 below.
Exhibit 3: How the future unfolds

Don’t worry. We know that you’re undervalued.
The chart shows what happened to the “market value” of all the companies that were trading at or above the price of risk in December 2012 (“undervalued” and therefore a (B)) and all the companies that were trading below the price of risk and were therefore “overvalued” and designated as an (N).
The chart also shows what happened if there was no change in the portfolio composition. However, all of the former companies (the (B)’s) were eligible for inclusion in the Perpetual Bond™ at that time and that portfolio evolved as the year progressed to sell 79 of them and buy 164 of them (sometimes the same ones) that emerged from the (N)-zone, so to speak.
The portfolio returned +42% on a cash basis and +68% on a modestly leveraged (by the margin account) basis and currently has 420 companies in it.
Exhibit 4: (B)(N) NEM Newmont Mining Corporation – Risk Price Chart

(B)(N) NEM Newmont Mining Corporation
Newmont Mining Corporation is engaged in the exploration for and acquisition of gold properties. It is also engaged in the production of copper, mainly through its Batu Hijau operation in Indonesia and Boddington operation in Australia.
(Please Click on the Chart to make it larger if required.)
From the Company: Newmont Mining Corporation, together with its subsidiaries, engages in the acquisition, exploration, and production of gold and copper properties. The companys assets or operations are located in the United States, Australia, Peru, Indonesia, Ghana, Mexico, and New Zealand. As of December 31, 2012, it had proven and probable gold reserves of approximately 99.2 million ounces and an aggregate land position of approximately 29,000 square miles. The company was founded in 1916, has 16,400 employees and is headquartered in Greenwood Village, Colorado.
For more information on the chart elements and additional references to the theory, please see our recent Post, The RiskWerk Company Glossary.
And for more on what risk averse investing has done for us this year, please see our recent Posts on The S&P TSX “Hangdog” Market or The Wall Street Put or specialty markets such as The Dow Transports & Utilities or (B)(N) The Woods Are Burning, or for the real class action, La Dolce Vita – Let’s Do Prada! and It’s For You, Dear on the smartphone business.
And for more stocks at high prices, The World’s Most Talked About Stocks or Earnings Don’t Matter – NASDAQ 100. And for more on what’s Working in America, Big Oil, Shopping in America or Banking in America, to name just a few.
Postscript
We are The RiskWerk Company and care not a jot for mutual funds, hedge funds, “alternative investments”, the “risk/reward equation” and every other unprovable artifact of investment lore. We have just one product
The Perpetual Bond™
Alpha-smart with 100% Capital Safety and 100% Liquidity
Guaranteed
With No Fees and No Loads on Capital
For more information on RiskWerk, please follow the Tags or Categories attached to this Letter or simply enter Search for additional references to any term that we have used. Related data may be obtained from us for free in a machine readable format by request to RiskWerk@gmail.com.
Disclaimer
Investing in the bond and stock markets has become a highly regulated and litigious industry but despite that, there remains only one effective rule and that is caveat emptor or “buyer beware”. Nothing that we say should be construed by any person as advice or a recommendation to buy, sell, hold or avoid the common stock or bonds of any public company at any time for any purpose. That is the law and we fully support and respect that law and regulation in every jurisdiction without exception and without qualification to the best of our knowledge and ability. We can only tell you what we do and why we do it or have done it and we know nothing at all about the future or the future of stock prices of any company nor why they are what they are, now. The author retains all copyrights to his works in this blog and on this website. The Perpetual Bond®™ is a registered trademark and patented technology of The RiskWerk Company and RiskWerk Limited (“Company”) . The Canada Pension Bond®™ and The Medina Bond®™ are registered trademarks or trademarks of the Company as are the words and phrases “Alpha-smart”, “100% Capital Safety”, “100% Liquidity”, ”price of risk”, “risk price”, and the symbols “(B)”, “(N)” and N*.
