(B)(N) Dow 55,000 (And We Missed It!)
Drama. The Street has made the bold prediction that the Dow could reach a generational high of 55,000 (from the current 15,000) in seven years – this seven to be exact (The Street, October 11, 2013, Jonas Emerraji: Why I’m Sticking By Dow 55,000). That’s ponderous, and scary, but we also think that it might be true. We’ve already done the first year and all we need is six more like it, which is neither too much to ask nor too much to expect.
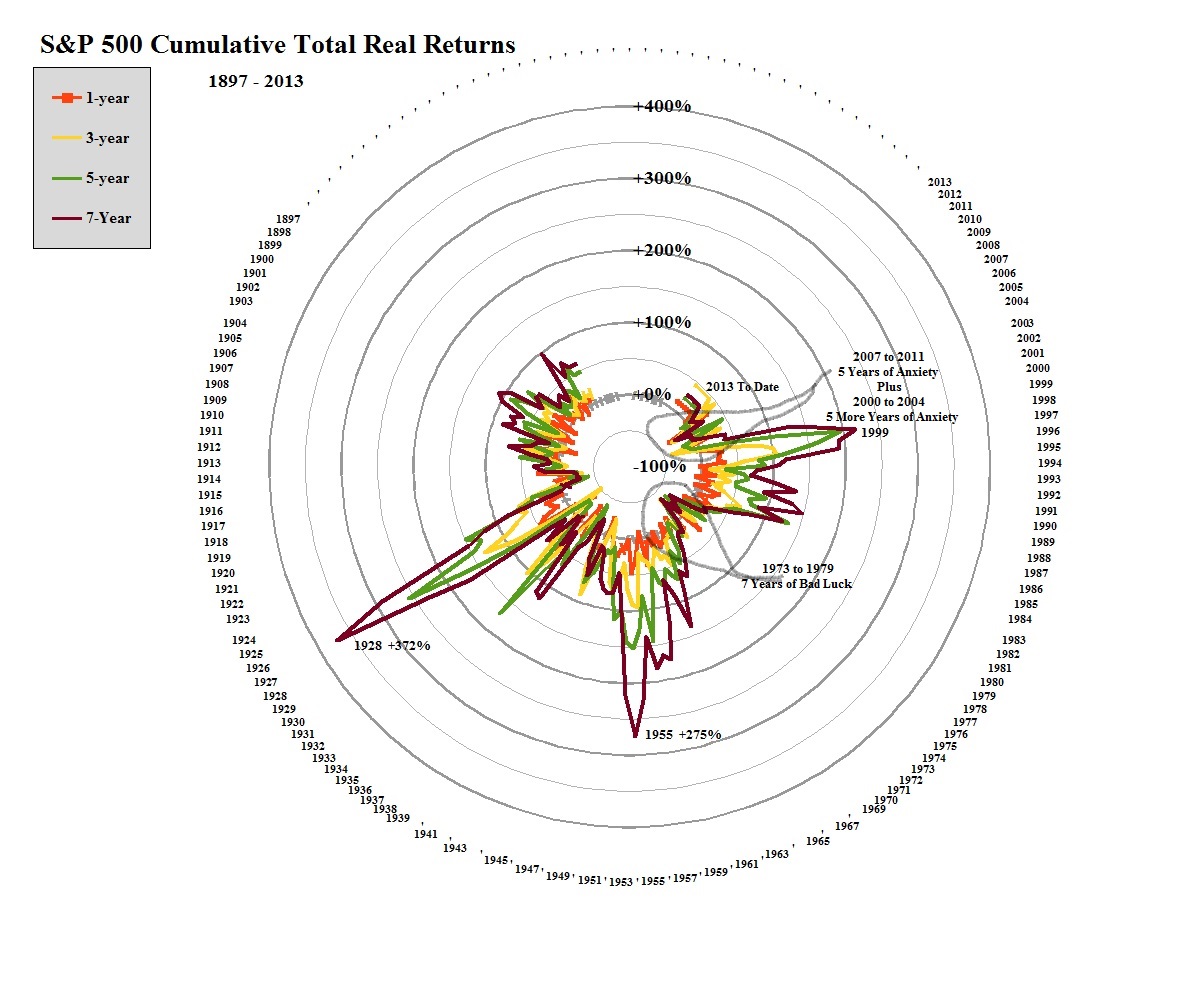
S&P 500 Total Real Returns
1, 3, 5 and 7-years
Data Courtesy Of: Robert J. Shiller, Yale University, 2013
For precedence, there have been three other times in which the market gained +200% (to triple) in seven years; those were the years ending in 1928, 1955 and 1999 and many more in which the market at least doubled (+100%). (Please Click on the Chart and again to make it larger.)
Moreover, these are real returns (net of inflation) on stock prices and dividends, and anything above +100% on that chart will be close enough to price returns of +200% that will be picked up in the Index at 55,000.
On the other hand, there are also lots of years in which the market ended up below +100% (after seven years) and several years in which it ended up below zero such as the post-war years, 1918 and 1945, and 1935, and between 1973 and 1979, and more recently, 2004 and 2011.
And if the Dow is 55,000, then the other markets won’t be far behind and are more likely to be ahead of it. Please see Exhibit 1 below.
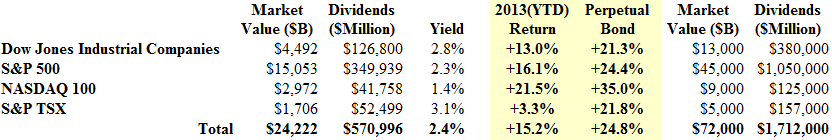
Exhibit 1: Dow 55,000 in 2013 to 2019 (Seven years)
(Please Click on the Chart to make it larger if required.)
The Dow plus the other New York and Toronto markets (S&P TSX) are currently worth $24 trillion and will pay $571 billion in dividends this year for an aggregate yield of 2.4%.
In addition, the Dow is up +13% and the combined markets are up +15% (Total line) where the “combination” of the returns is weighted by the value of the markets and excludes the dividends.
Piggy Bank $50 Trillion “New Money”
But if the Dow is up to 55,000 and has tripled, and the other New York markets tend to outperform the Dow, we should expect a market with an aggregate value of at least $72 trillion that pays a dividend of $1.7 trillion every year (right-hand side of the chart) and it raises the question of where are we going to get $50 trillion of new investment in the next six years? An amount that dwarfs the fortunes accumulated in the last one hundred years.
Undoubtedly, we can help. With reference to Exhibit 1, the full market Perpetual Bond™ currently has 620 companies in it and, just as importantly, 260 that are not, and it is doing better than the market (by 50% or more) in every market and the weighted return is +24% to date.
At that rate, the full market Perpetual Bond™ will triple in five years and the Dow will catch up two years later. Which is why we missed it and are doing it ourselves.
And if the market doesn’t come up with the new money, we’re going to have to take it away from the “old money” who are “spinning the wheel” and come into the market, now and then. And we know exactly how we’re going to do it because we’re doing it now and have been doing it all year.
Exhibit 2: (B)(N) Dow Jones Industrial Companies – Prices & Perpetual Bond™ – October 2013

Dow Jones Industrial Companies – Prices & Perpetual Bond – October 2013
(Please Click on the Chart to make it larger if required.)
Exhibit 3: (B)(N) Dow Jones Industrial Companies – Portfolio and Cash Flow Summary – October 2013

Dow Jones Industrial Companies – Portfolio and Cash Flow Summary – October 2013
(Please Click on the Chart to make it larger and again in required.)
The current Perpetual Bond™ in the Dow has twenty-seven companies in it and three (Caterpillar, Microsoft and Intel) that are not and have not been included all year. Please see Exhibit 2 above.
The Dow Index is “price weighted”; that is, its value is proportional to the sum of the stock prices of all the companies that are in it and has returned +13% so far this year.
However, because there only thirty companies in the domain, and the stock prices vary between less than $50 and more than $200, we developed the portfolio with a more or less equal amount of money in each company using the ambient stock prices in the nine months preceding December 2012.
The portfolio value in early January (end of December) was $276,147 (in units of $1000 or $1 million, depending only on our budget) and is now worth $339,228 for a gain of +22.8% (please see the Total line in Exhibit 3).

The RiskWerk Company
On the other hand, the leveraged portfolio (Portfolio line) which uses the margin account and does not require any new money in excess of the cash account in order to maintain it, was also booked at $276,147 in December but is now worth $373,958 for a portfolio gain of +35.4% (plus dividends) as long as we’re running it; that is, for as long as we don’t sell the stocks to close the margin account or go to cash.
And we’re all set for 2014 which is coming soon.
For more information on the Chart Elements, please see our recent Post, The RiskWerk Company Glossary.
For more on what risk averse investing has done for us this year, please see our recent Posts on The S&P TSX “Hangdog” Market or The Wall Street Put or specialty markets such as The Dow Transports & Utilities or (B)(N) The Woods Are Burning, or for the real class action, La Dolce Vita – Let’s Do Prada! and It’s For You, Dear on the smartphone business.
And for more stocks at high prices, The World’s Most Talked About Stocks or Earnings Don’t Matter – NASDAQ 100.
Postscript
We are The RiskWerk Company and care not a jot for mutual funds, hedge funds, “alternative investments”, the “risk/reward equation” and every other unprovable artifact of investment lore. We have just one product
The Perpetual Bond™
Alpha-smart with 100% Capital Safety and 100% Liquidity
Guaranteed
With No Fees and No Loads on Capital
For more information on RiskWerk, please follow the Tags or Categories attached to this Letter or simply enter Search for additional references to any term that we have used. Related data may be obtained from us for free in a machine readable format by request to RiskWerk@gmail.com.
Disclaimer
Investing in the bond and stock markets has become a highly regulated and litigious industry but despite that, there remains only one effective rule and that is caveat emptor or “buyer beware”. Nothing that we say should be construed by any person as advice or a recommendation to buy, sell, hold or avoid the common stock or bonds of any public company at any time for any purpose. That is the law and we fully support and respect that law and regulation in every jurisdiction without exception and without qualification to the best of our knowledge and ability. We can only tell you what we do and why we do it or have done it and we know nothing at all about the future or the future of stock prices of any company nor why they are what they are, now. The author retains all copyrights to his works in this blog and on this website. The Perpetual Bond®™ is a registered trademark and patented technology of The RiskWerk Company and RiskWerk Limited (“Company”) . The Canada Pension Bond®™ and The Medina Bond®™ are registered trademarks or trademarks of the Company as are the words and phrases “Alpha-smart”, “100% Capital Safety”, “100% Liquidity”, ”price of risk”, “risk price”, and the symbols “(B)”, “(N)” and N*.
