The Wall Street “Spin” For Sale
Drama. Wall Street is getting nervous. Like a spinning top, it might fall over when the spin stops (The Street, June 21, 2013, Cramer: Right Now, I’d Just as Soon Be a Seller) because the real question is not about economics.

The Wall Street Precession In The Primary Market Top Spin
The real question is about “absent the spin“, can Wall Street function? Will there be a Wall Street absent the glib and the gullible?
And the answer is, Yes, of course, but there will also be a lot of unemployment in the secondary market, which they are used to in any case, and it is the reason that so many “hedge funds” are chasing The RiskWerk Company (Reuters, June 21, 2013, Exclusive: Cantor Fitzgerald to start wealth management business) because they don’t know how to do what we do with or without the spin.

The Lost Trader’s Jacket
Courtesy: John Wiley & Sons Limited 2009
The Wall Street “spin” creates a new primary market within the secondary market – cash to bonds to equities to bonds to cash – and is unlike market-making in the primary market which is disciplined by experienced and regulated underwriters and market-makers – cash to new bonds, or cash to new equities, and new bonds and new equities to cash on the balance sheet – and not just into their pockets through fees and the opportunistic secondary market trading gains of one investor cum wannabe trader to the losses of another investor cum wannabe trader.
The secondary “spin” market is also regulated by the Securities and Exchange Commission (SEC) but in a different way – they may lose their desk and telephone, and maybe their suits, but the underwriters and market-makers lose their jackets if they misbehave.
However, even the best at bonds in the secondary market doesn’t know how to get reliable returns at any time – $1 trillion is traded every day and bonds are not meant to be held to maturity in the secondary market – and over the long time, they get +5% to +6% which is not even comparable to the gains that we had on The Wall Street Put in just January and February of this year, so far, and we keep everything that we get.
In our view, the so-called “flight to safety” in government and corporate bonds is a delusion, but its effects are reel enough, so to speak.
So, we’ve checked The Perpetual Bond™ in The Wall Street Put (March and April) to see how we’re doing, and to tighten up our stop/loss and collar strategies in case the spin is on, and we can say thank you very much. Please see our mid-April Post for more details.
Exhibit 1: Summary Year-to-Date of the Perpetual Bond™
The Perpetual Bond – June 2013
(Please Click on the Chart to make it larger if required.)
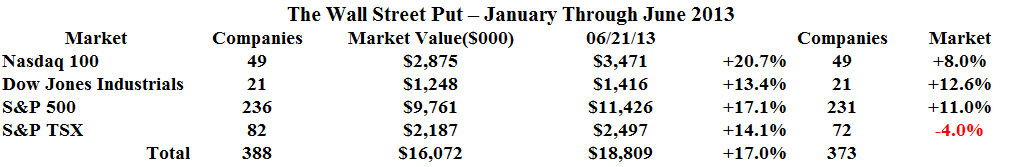
The composition of the portfolio has hardly changed since December but the portfolio gains are +17% in aggregate plus another 2% or 3% in dividends, some of which are still forthcoming. Please see the Exhibits below for more details.
Although there are many new companies that we could add to the portfolio, we’ve kept this one the same except for companies that needed to be sold because of a (B)- to (N)-transition that signifies the perception of an increased or increasing risk to risk averse investors who can be demonstrated to effectively demand that their investments should be “as good as cash” and “better than money”. For an explanation of these concepts, please our Post on The Price of Risk or more specific examples in the (B)(N)-Company Posts.
The NASDAQ-100 Companies and Index represent the largest non-financial domestic and international securities listed on The NASDAQ Stock Market and the Index itself is not price-weighted (as we do in these reports) but capitalization weighted so that portfolios of stocks that model the NASDAQ 100 Index will vary in their composition, under-weighting in expensive stocks (and “taking profits”) and over-weighting in cheaper stocks (and hoping that they will go up and not down) as the market unfolds. However, it will take thirty years for this “team” of mean-reversionists to get to the Super Bowl, possibly. Anything can happen.
In our case, the only change since January has been that Whole Foods Market had a stock split 2:1 in April and we’ve carried the pre-split price forward in these reports in order to simplify the comparisons with our January through April portfolio. April stock prices are also for the end of April rather than mid-April.
With no changes at all, The Perpetual Bond™ is up +21% (Total line) since the end of December and if we had known in December which companies could be bought in January, the portfolio would be up +23% (Companies line). Please see Exhibit 1 and 2 below.
We also note that the negative cash balances (Cash line in red) are due to the margin account (which we use only as a convenience) and that the Portfolio of stocks is currently worth $3,992,000 and up from $2,326,000 in December for a staggering gain of +72% in six months in the forty-three to forty-nine companies that we bought and held in the Perpetual Bond™. And our money as stocks was much better than our money as cash or bonds.
And we didn’t get a lot of help from the market which is up just +8% since December, and we must have bought the half of it that was going to do really well. But it wasn’t an accident and we know how to keep on doing it. Please see Exhibit 1 and 2 below.
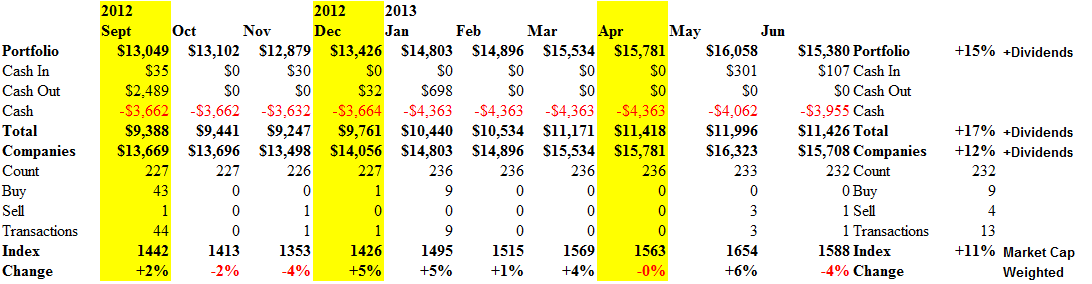
Exhibit 1: The Perpetual Bond™ NASDAQ 100 Companies – Cash Flow Summary – June 21, 2013
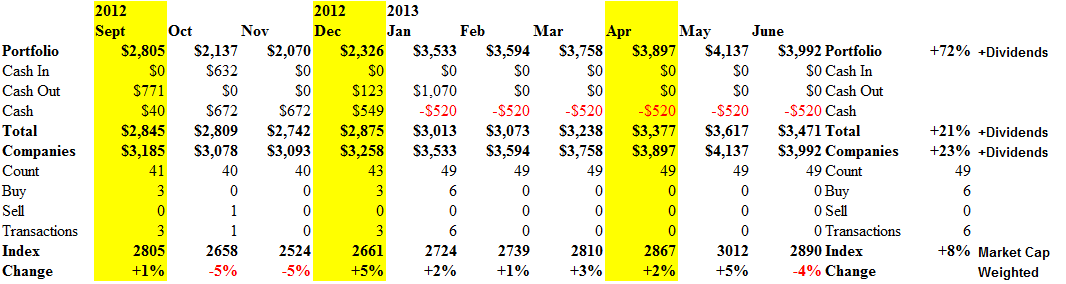
The NASDAQ 100 – Cash Flow – June 21, 2013
(Please Click on the Chart to make it larger if required.)
Exhibit 2: The Perpetual Bond™ NASDAQ 100 Companies – Portfolio Summary – June 21, 2013
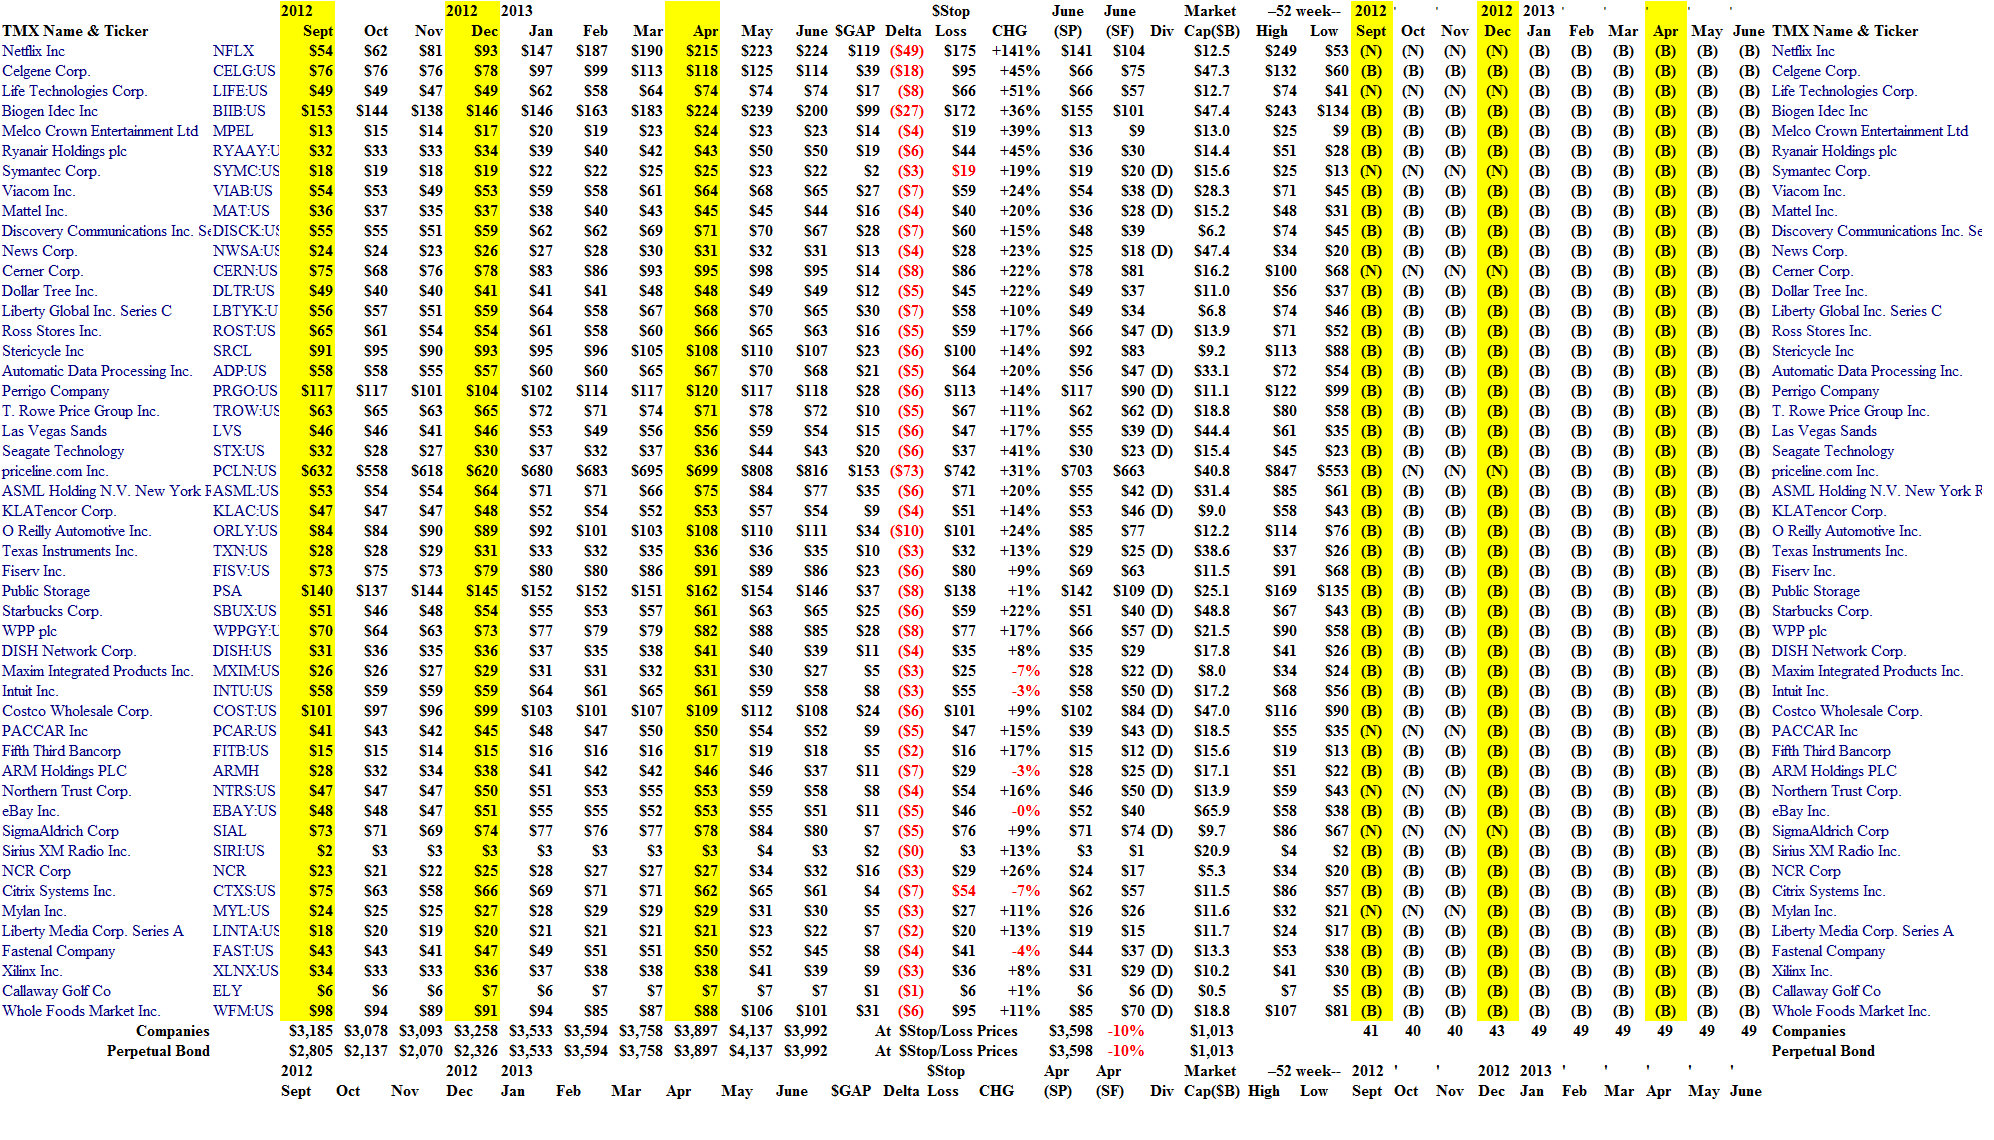
The NASDAQ 100 – Portfolio – June 21, 2013
(Please Click on the Chart to make it larger and again if required.)
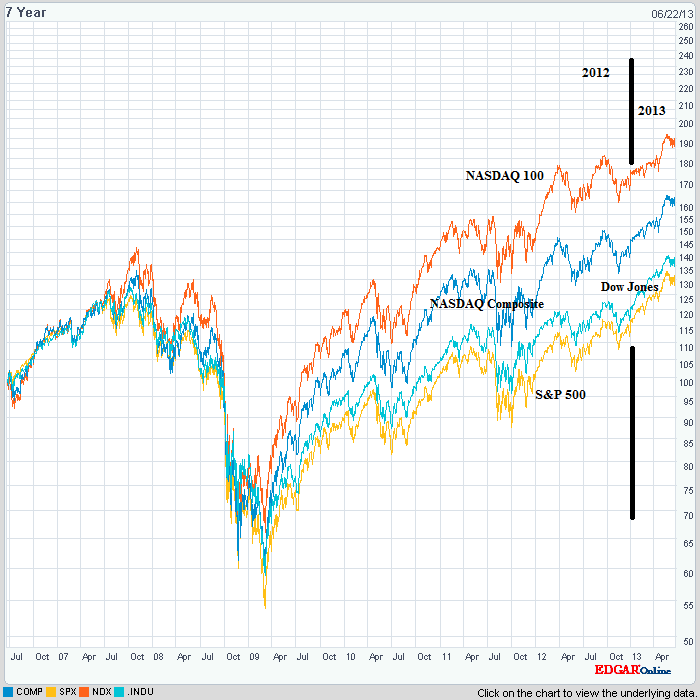
Market Index
Courtesy: NASDAQ
In contrast, the Index itself is up only +8%, and has had a lot of ups and downs over which we have no control, and doesn’t pay any dividends.
We also know how to protect the prices in our portfolio either through a stop/loss or collar on the companies in it, which, on balance, might cost us 2% of our returns, but it’s something that we can afford.
A stop/loss always makes sense because we can always buy the stock back at a lower price if it’s still in the Perpetual Bond™.
And we can use the collar to save more of the price using the long put near the current stock price, and we can partially offset the cost of the put by selling a call at a higher price against our long position; the net cost of the collar, and transaction costs which can be negotiated, is all that’s required in order to limit the range of the stock prices for the companies in our portfolio.
If we do nothing but set the stop/loss prices as indicated in Exhibit 2, then we could lose (-10%) of our gains if the market drops on everything, which could happen if the retail investors in the secondary market decide to “spin” with the spin and “take profits” (such as they are) and make our day.
If we were to “lighten up” and sell some stocks, the most likely stocks for us to sell are those that would trade below the price of risk at the stop/loss price (indicated in red). For example, Symantec has been in the Perpetual Bond™ since at least September at $18; it’s trading now at $22, and up +19% since December, but the stop/loss price of $19 would put it below the price of risk which is currently $20 (June SF).
Please see Exhibit 2 and the following Exhibits that demonstrate the same principles in the other North American markets.
Exhibit 3: The Perpetual Bond™ Dow Jones Industrial Companies – Cash Flow Summary – June 21, 2013

The Dow Jones Industrial Companies – Cash Flow – June 21, 2013
(Please Click on the Chart to make it larger if required.)
Exhibit 4: The Perpetual Bond™ Dow Jones Industrial Companies – Portfolio Summary – June 21, 2013
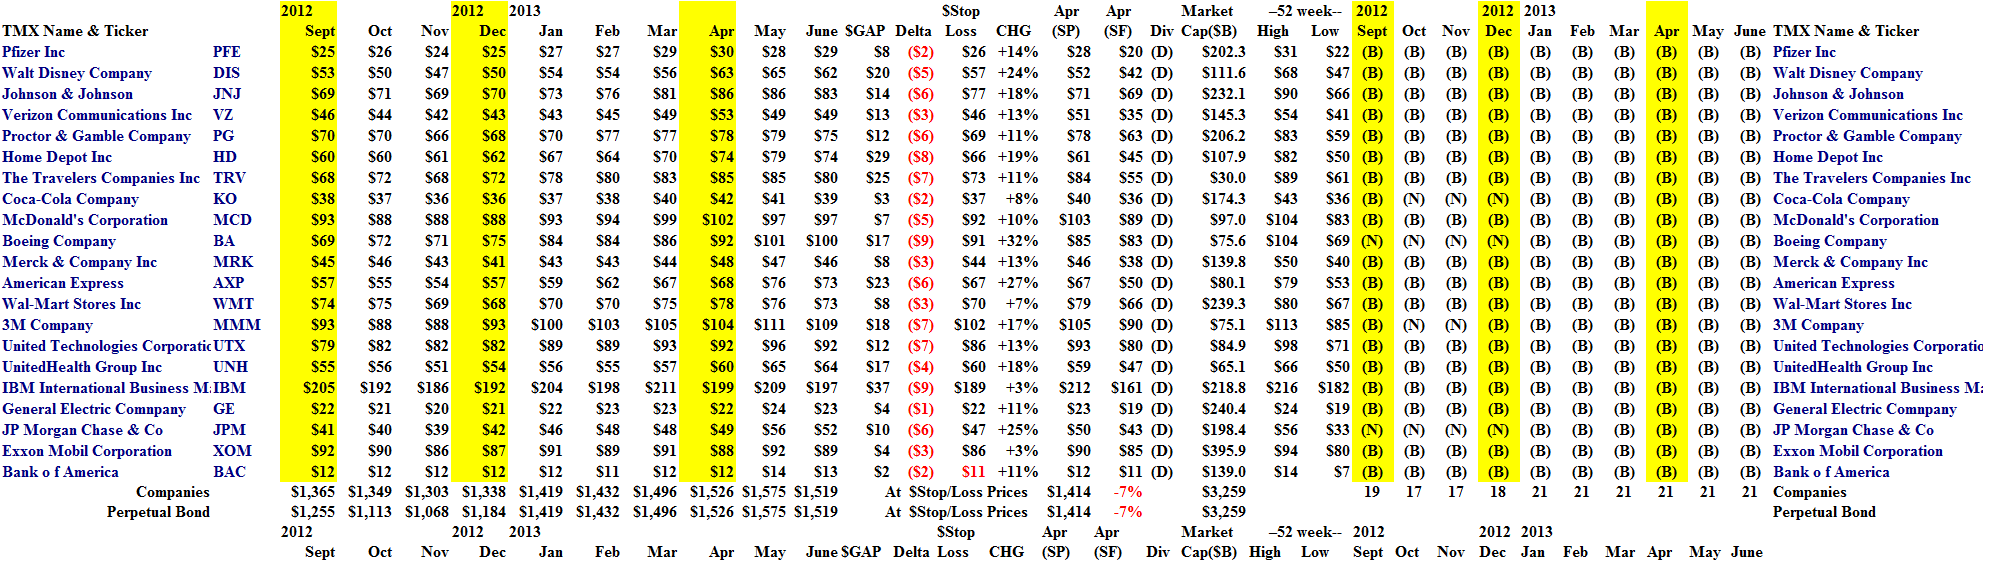
The Dow Jones Industrial Companies – Portfolio – June 21, 2013
(Please Click on the Chart to make it larger and again if required.)
Exhibit 5: The Perpetual Bond™ S&P 500 Companies – Cash Flow Summary – June 21, 2013
S&P 500 Companies – Cash Flow – June 21, 2013
(Please Click on the Chart to make it larger if required.)
We note that the large margin account ($3 to $4 million) has not been helpful in this market as it is slows down and becomes more volatile and uncertain; there are more than a dozen companies that we could sell because the volatility-based stop/loss price is below or close to the price the price of risk.
For example, Safeway is up +27% since December but the stop/loss price of $19 would price it below the price of risk at $20. Moreover, the company is planning to re-build its US business and has recently sold its Canadian business to Sobeys Incorporated.
Noble Energy is recorded with its pre-split prices. Please see Exhibit 6 below.
Exhibit 6: The Perpetual Bond™ S&P 500 Companies – Portfolio Summary – June 21, 2013
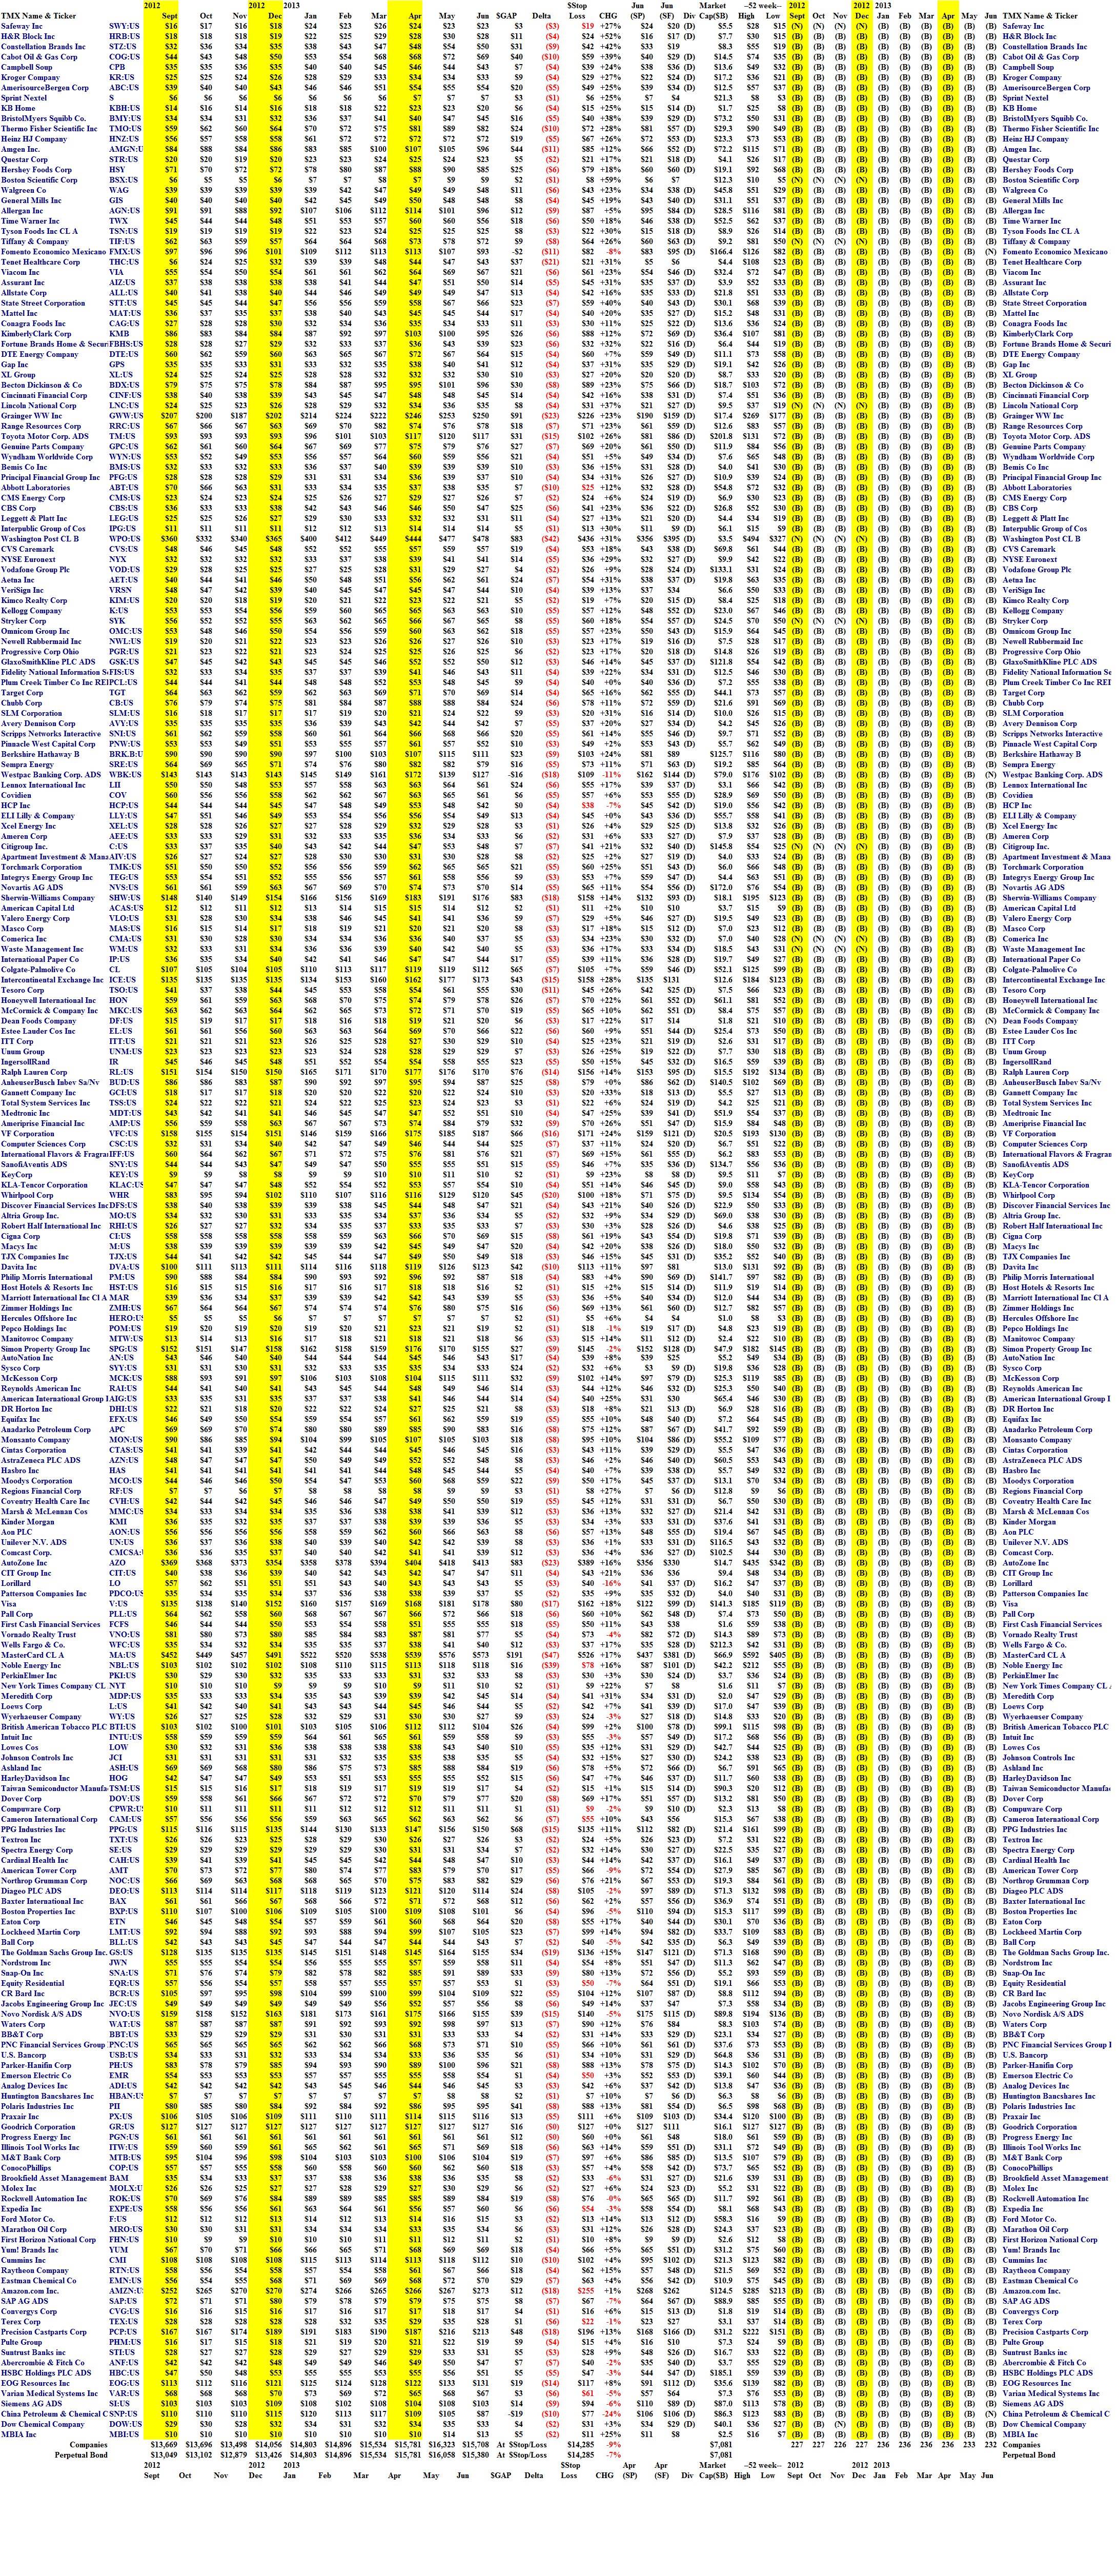
S&P 500 Companies – Portfolio – June 21, 2013
(Please Click on the Chart to make it larger and again if required.)
Exhibit 7: The Perpetual Bond™ S&P/TSX Companies – Cash Flow Summary – June 21, 2013

S&P TSX Composite Companies – Cash Flow – June 21, 2013
(Please Click on the Chart to make it larger if required.)
Atco and Canadian Utilities are shown with their pre-split prices and the Dundee Corporation has completed a re-structuring which is recorded as a $15 special dividend to the current $21 stock price. Please see Exhibit 8 below.
Exhibit 8: The Perpetual Bond™ S&P/TSX Companies – Portfolio Summary – June 21, 2013
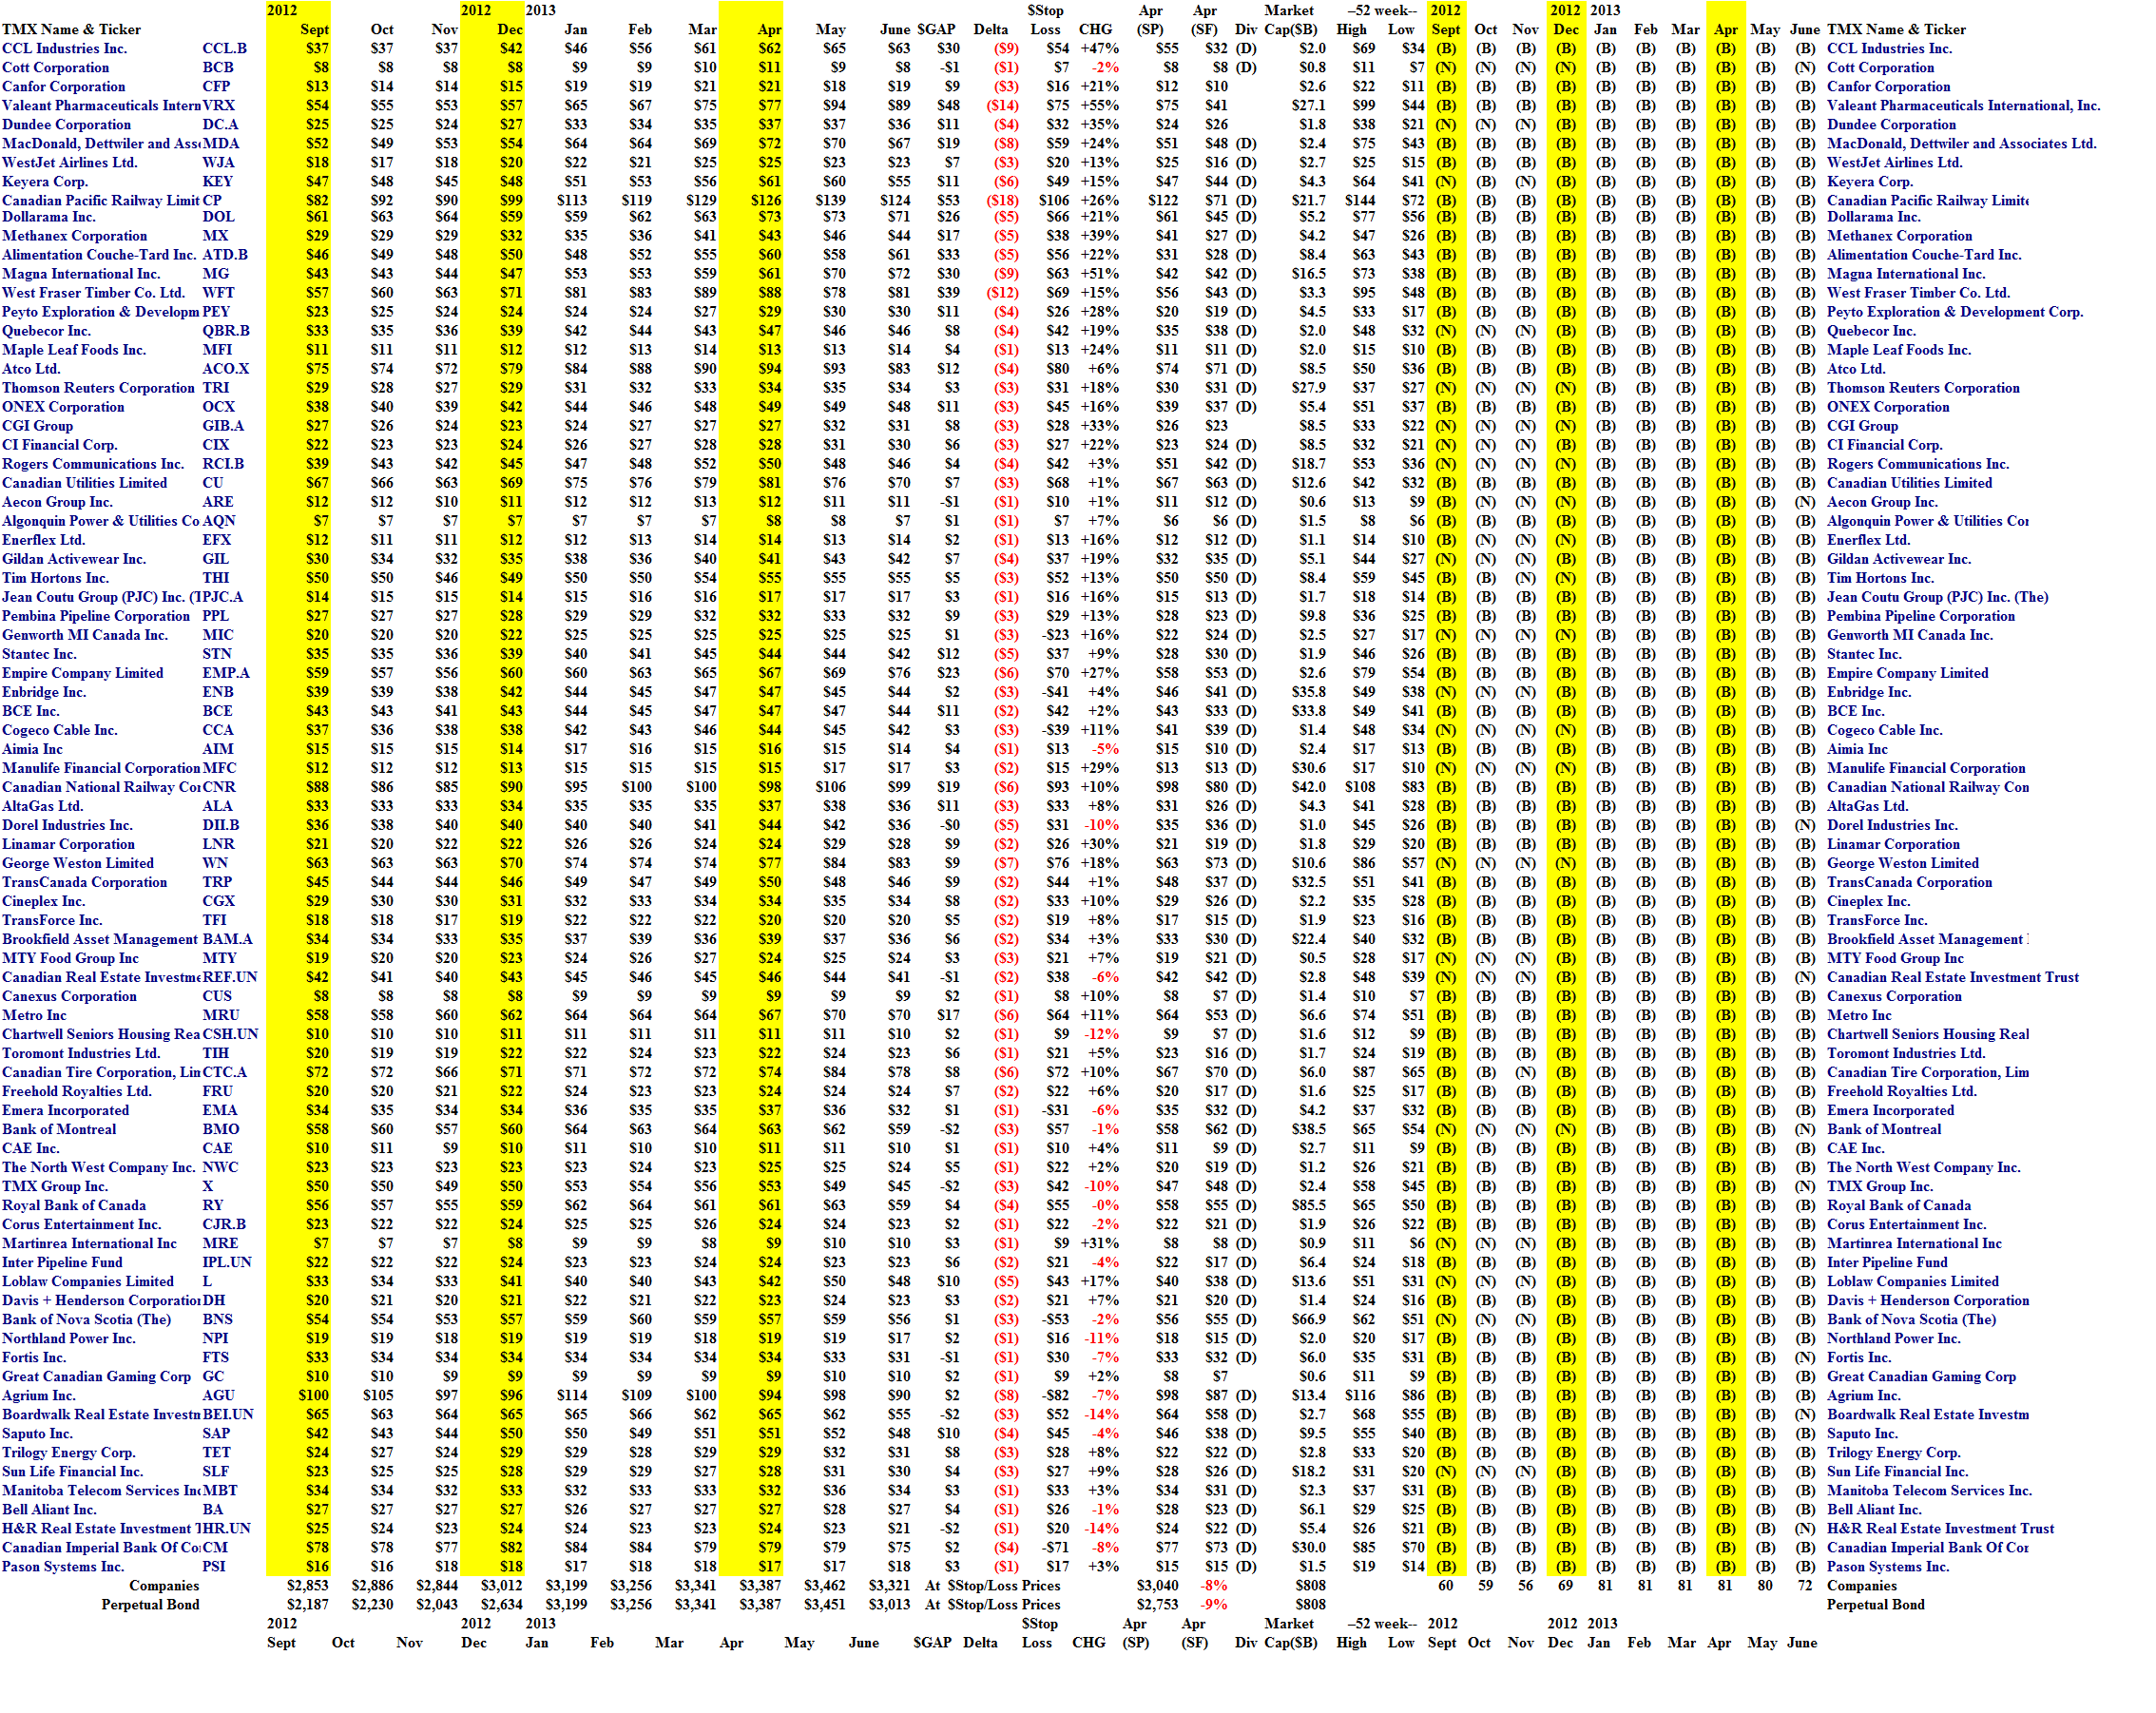
S&P TSX Composite Companies – Portfolio – June 21, 2013
(Please Click on the Chart to make it larger and again if required.)
The calculated Risk Price (SF) is a provably effective estimate of the “price of risk” which is “the least stock price at which the company is likeable” (Goetze 2006) and “likeability” is determined by the demonstrated factors of “risk aversion” – we want to keep our money and obtain a hopeful return above the rate of inflation – and the properties of portfolios of such stocks. Stock prices that are less than the price of risk can be said to be “bargain prices” but with the risk attached that the company might never get a higher price other than that due to ambient volatility or “surprise”; on the other hand, investors who are willing to pay the “full price” above the price of risk, and buy and hold the stock at those prices, must also be confident, and have reason to believe, that the company will produce those values, absent new information.
Please see our Posts, The Price of Risk, August 2012 and The Nash Equilibrium & Its Stock Price, October 2012, for more information on the theory.
To see what else “risk averse” investing can do for us, please see our recent Posts, The Wall Street Put, April 2013, and earlier Posts such as The Dow Transports, March 2013, or The Risk Adjusted Dow, March 2013, or The Canada Pension Bond, February 2013, and for a more colorful description of investment risk and the application of the “price of risk” to mergers & acquisitions, please see our Post, Bystanders & Collateral Damage, April 2013.
Postscript
We are The RiskWerk Company and care not a jot for mutual funds, hedge funds, “alternative investments”, the “risk/reward equation” and every other unprovable artifact of investment lore. We have just one product
The Perpetual Bond™“
Alpha-smart with 100% Capital Safety and 100% Liquidity”
Guaranteed
With No Fees and No Loads on Capital
For more information on RiskWerk, please follow the Tags or Categories attached to this Letter or simply enter Search for additional references to any term that we have used. Related data may be obtained from us for free in a machine readable format by request to RiskWerk@gmail.com.Disclaimer Investing in the bond and stock markets has become a highly regulated and litigious industry but despite that, there remains only one effective rule and that is caveat emptor or “buyer beware”. Nothing that we say should be construed by any person as advice or a recommendation to buy, sell, hold or avoid the common stock or bonds of any public company at any time for any purpose. That is the law and we fully support and respect that law and regulation in every jurisdiction without exception and without qualification to the best of our knowledge and ability. We can only tell you what we do and why we do it or have done it and we know nothing at all about the future or the future of stock prices of any company nor why they are what they are, now. The author retains all copyrights to his works in this blog and on this website. The Perpetual Bond®™ is a registered trademark and patented technology of The RiskWerk Company and RiskWerk Limited (“Company”) . The Canada Pension Bond®™ and The Medina Bond®™ are registered trademarks or trademarks of the Company as are the words and phrases “Alpha-smart”, “100% Capital Safety”, “100% Liquidity”, ”price of risk”, “risk price”, and the symbols “(B)”, “(N)” and N*.
