The Seven Year Itch Since 1897
Essay. The “market” has never caused anyone to lose all their money (absent a margin debt) over a seven year period, but it’s come close, of which the worst of times appears to have been in the 70’s and as recently as ten years ago. Please see Exhibit 1 below (Brown line which is the cumulative seven year compounded real return).
Exhibit 1: S&P 500 Cumulative Total Real Return – 1, 3, 5 and 7-Year Returns
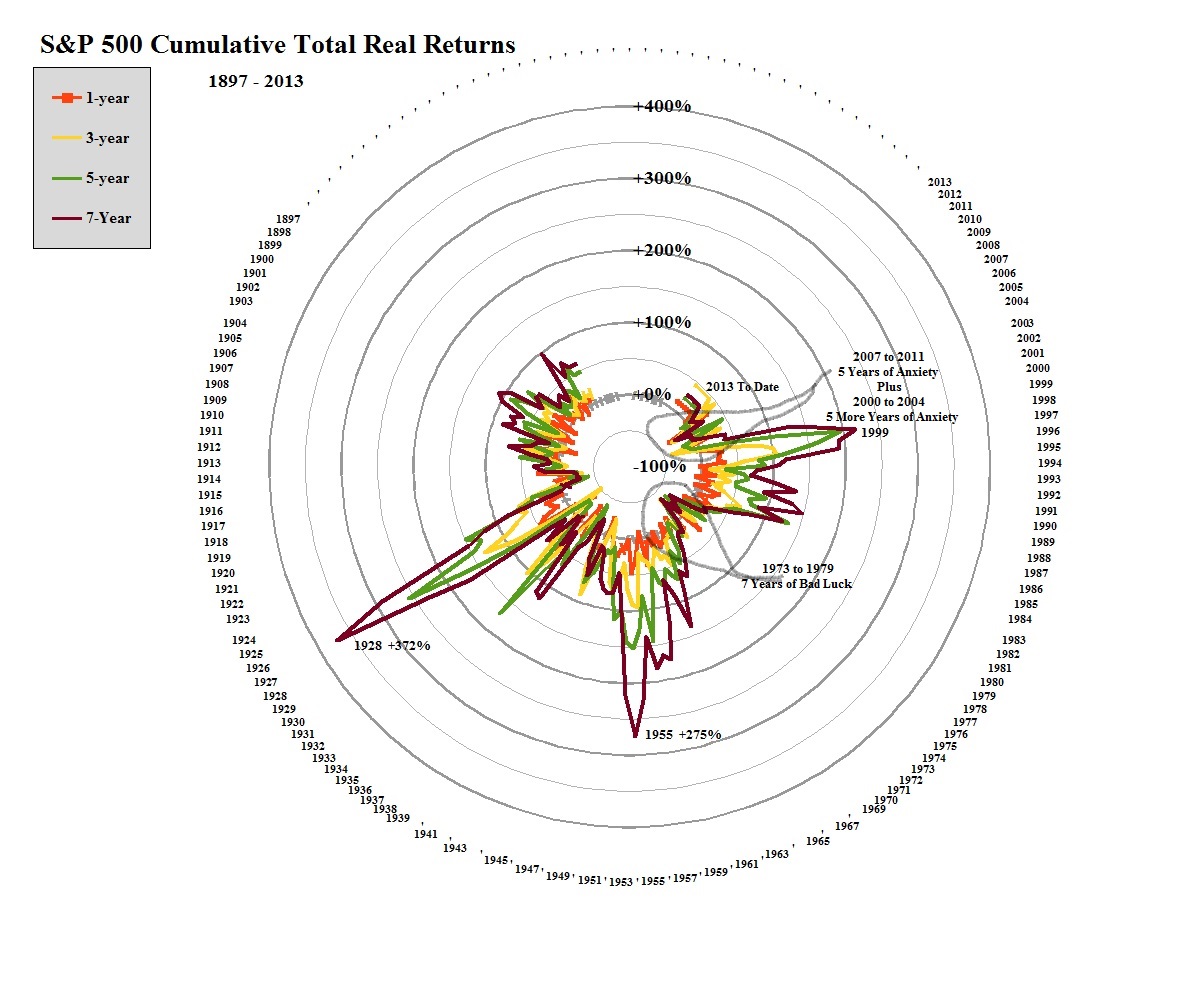
S&P 500 Cumulative Total Real Returns
Data Courtesy Of: Robert J. Shiller, Yale University, 2013
The Total Real Returns include dividend income as well as capital gains in the S&P 500 companies, all adjusted for the Consumer Price Index (CPI), so that these are “real dollars” net of inflation. They’re as good now as they were then.
(Please Click on the Chart to make it larger and again if required.)
The returns include the year as marked so that, for example, the 7-year return for the year-to-date includes this year’s return of +12%, so far, compounded with +15% (2012), -1% (2011), +14% (2010), +29% (2009), -35% (2008), -5% (2007) and +11% (2006) for a total of +28% (Brown line in the Chart) in the seven years of most recent memory since 2006. (Please note that the numbers don’t add because they’re compounded.)
But these are not the worst of times – one could live with a +3.5% return above the rate of inflation – because in the last twenty years, if we were not fully invested in 1993, we never made more than +200% (tripled our money by the end of 1999) in any three, five, or seven year period, unlike our fathers in 1928 and 1955 who might soon be wondering how we’re going to pay their pensions. Please see Exhibit 2 below.
With a little luck, they might have had some help from our grandfathers who still had money to invest in 1931 and 1932 – the year after, 1933, was already too late – and although 1942 and 1943 were also good years, they were likely busy elsewhere, and, after the War and after Korea, even more pain began in 1955 for the Company Men and didn’t end for another seven years (as marked in Exhibit 2 below).
Exhibit 2: S&P 500 Cumulative Total Real Return – 20 and 30-Year Returns

S&P 500 Total Real Returns – 20 & 30 Year
The S&P 500 Index is price-weighted so that these are the results that would be obtained by simply buying the index or, for example, 1,000 shares of every company in it for $23 million today and holding them for the next twenty or thirty years, which, in many respects, is what most pension plans more or less have to do.
(Please Click on the Chart to make it larger and again if required.)
These Charts suggest that any time is a good time to invest but the best time recently was in March 2009, but it’s hard to imagine that even now is already too late – what’s four or five years in twenty or thirty – or that the outcome in 2032 or 2042 is not going to be what we hoped for.
However, these Charts suggest that anything can happen in any time-frame, and that technologies such as “risk management” by tabulating volatility and co-volatility and “minding our tails”, so to speak, and the Capital Assets Pricing Model (CAPM), and Modern Portfolio Theory (MPT) are useless and mean nothing.
In contrast, the Perpetual Bond™ maintains an active partition of these markets into a portfolio of stocks, the (B)-portfolio, that behaves like a “bond” – that is, we expect that our money will always be “as good as cash” because we actively enforce 100% capital safety and, obviously, have 100% liquidity, and, secondly, that our cash as money is “better than money” because it’s an investment that is likely to obtain a return above the rate of inflation, that is, a non-negative real rate of return; and a portfolio of stocks, the (N)-portfolio, that behaves like a portfolio of stocks which price is essentially driven by “risk seeking” and “risk taking” investors, and, in aggregate, can be shown to expect a zero or negative return, enforcing neither capital safety nor a hopeful non-negative real rate of return.
We also note, of course, that we are always fully engaged with the market and, in effect, create our own “bond” with a return that depends, ultimately, on the productivity of the companies in the economy, wherever it is, and not on government largess and miscalculations.
The calculated Risk Price (SF) is a provably effective estimate of the “price of risk” which is “the least stock price at which the company is likeable” (Goetze 2006) and “likeability” is determined by the demonstrated factors of “risk aversion” – we want to keep our money and obtain a hopeful return above the rate of inflation – and the properties of portfolios of such stocks. Stock prices that are less than the price of risk can be said to be “bargain prices” but with the risk attached that the company might never get a higher price other than that due to ambient volatility or “surprise”; on the other hand, investors who are willing to pay the “full price” above the price of risk, and buy and hold the stock at those prices, must also be confident, and have reason to believe, that the company will produce those values, absent new information.
Please see our Posts, The Price of Risk, August 2012 and The Nash Equilibrium & Its Stock Price, October 2012, for more information on the theory.
To see what else “risk averse” investing can do for us, please see our recent Posts, The Wall Street Put, April 2013, and earlier Posts such as The Dow Transports, March 2013, or The Risk Adjusted Dow, March 2013, or The Canada Pension Bond, February 2013, and for a more colorful description of investment risk and the application of the “price of risk” to mergers & acquisitions, please see our Post, Bystanders & Collateral Damage, April 2013.
Postscript
We are The RiskWerk Company and care not a jot for mutual funds, hedge funds, “alternative investments”, the “risk/reward equation” and every other unprovable artifact of investment lore. We have just one product
The Perpetual Bond™“
Alpha-smart with 100% Capital Safety and 100% Liquidity”
Guaranteed
With No Fees and No Loads on Capital
For more information on RiskWerk, please follow the Tags or Categories attached to this Letter or simply enter Search for additional references to any term that we have used. Related data may be obtained from us for free in a machine readable format by request to RiskWerk@gmail.com.Disclaimer Investing in the bond and stock markets has become a highly regulated and litigious industry but despite that, there remains only one effective rule and that is caveat emptor or “buyer beware”. Nothing that we say should be construed by any person as advice or a recommendation to buy, sell, hold or avoid the common stock or bonds of any public company at any time for any purpose. That is the law and we fully support and respect that law and regulation in every jurisdiction without exception and without qualification to the best of our knowledge and ability. We can only tell you what we do and why we do it or have done it and we know nothing at all about the future or the future of stock prices of any company nor why they are what they are, now. The author retains all copyrights to his works in this blog and on this website. The Perpetual Bond®™ is a registered trademark and patented technology of The RiskWerk Company and RiskWerk Limited (“Company”) . The Canada Pension Bond®™ and The Medina Bond®™ are registered trademarks or trademarks of the Company as are the words and phrases “Alpha-smart”, “100% Capital Safety”, “100% Liquidity”, ”price of risk”, “risk price”, and the symbols “(B)”, “(N)” and N*.
