The End Is Nigh When It Tilts To High
Essay. In our recent Post, The Consumer Reports For Socks & Stocks, May 2013, we introduced a new measure of investor risk aversion that shows the preponderance of call option contracts over put option contracts as the ratio [Daily Put/Calls Ratio] applied to the actual stock market index, in this case, the S&P 500 (please see Exhibit 1 below).
We can see, right away, that the market, in aggregate, was light on calls and heavy on puts before the crash of 2008; and heavy on calls in the recovery between 2009 and 2011; and light again at the top of the market in 2011 and heavy on puts; and then the reverse after the market bottom in late 2011; and it’s heavy on calls now, suggesting that the market is hoping that there is more to gain, else their calls are more likely to expire without value; that is, out of the money.
And the reverse is true if the market is light on calls and heavy on puts (more orange above the blue line; putting weight on the blue line, so to speak, as is evident in late 2011, and again in the second quarter of 2012, but the reverse later in the year and going into 2013).
Exhibit 1: The New Risk Culture – The End Is Nigh When It Tilts To High
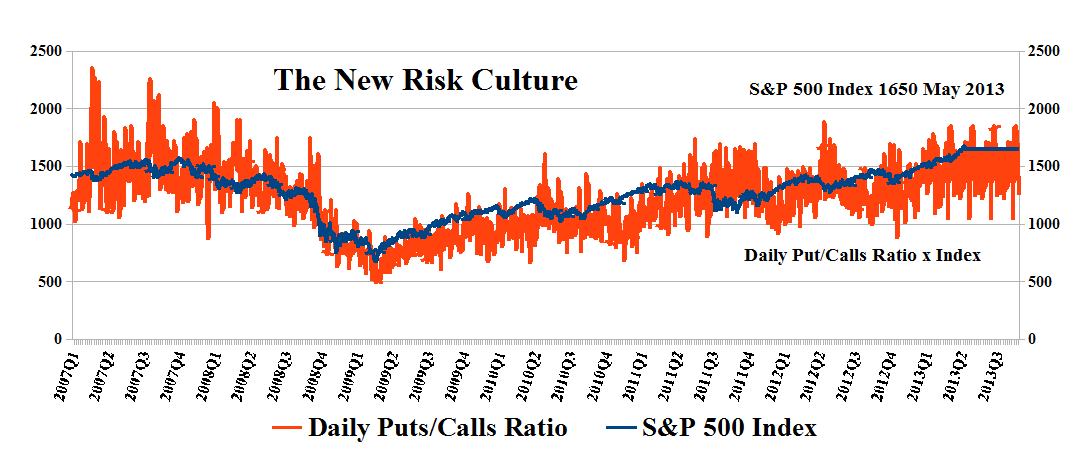
Exhibit 2: The New Risk Culture & The Market Price of Risk SF = [P/C] × SP
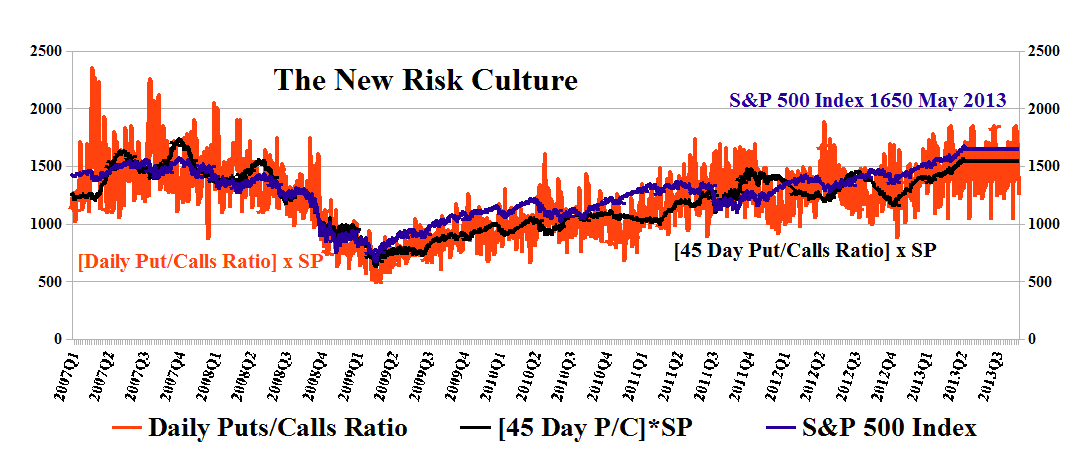
The New Risk Culture & The Market Price of Risk
(Please Click on the Chart to make it larger if required.)
The indicator is obviously “forward looking” and options on millions of shares, of hundreds of companies, are positioned for execution in every time frame by tens of thousands of investors. And that’s conservative (![]() CBOE Options Volume).
CBOE Options Volume).
Does the Chart foretell the future? Can we use it as a predictive model? Does the Chart “read the mind of the market”, so to speak?
The answer is that we think it does, but we also think that it might be more accurate in predicting a “down market” than an “up market”; hence, the subtitle “The End Is Nigh If It Tilts To High”.
The reason is that the “heavy put” scenario (“like hanging chads”) has a better chance of eliminating an “arbitrage effect”; if investors see that the market is heavy on puts, and, therefore, “the tilt is high”, and if they decide to buy protective puts, as well, then the money has to come from the money that might otherwise be used to buy stocks, even if the money is coming from cash or bonds. If the “short market” is also active, then even more money will be side-lined pending a “market failure”.
Hence, we might expect less demand for stocks, and, therefore, lower prices for those who need to sell their stocks, such as insurance companies who need to pay benefits. Or, there could also be an emerging “flight to safety” because bond yields are up, or expected to go up. Please see our Post, The Yale Method, May 2013, for information about how the “big money” market “thinks” using the Capital Assets Pricing Model (CAPM) and Modern Portfolio Theory (MPT).
On the other hand, if the money is flowing into buying calls, and the market is “heavy on calls”, then that money is not going into buying stocks because the investors don’t really know which ones to buy now but they expect to buy higher priced stocks at lower prices later, using their calls. And that equation can be enforced, too, by a lot of new money from bonds, applied across the board, so to speak, which would tend to drive the market higher, and fulfill the prophecy in a “flight to risk” and higher inflation, we guess (“econo-speak”).
Fortunately, we don’t really care (that much) because our portfolio is always “as good as cash” and “better than money”, regardless of the market, whether up, down, or indifferent. We’re always in the market and our “money” as stocks is likely to be better than cash and we know that all of the time. Please see The Price of Risk, below.
The Market Price of Risk
Still, we think that it’s an interesting idea, and it could be helpful in understanding the current market and clearing away some of the fog that seems to bedevil the pundits who are paid to peer into the future, but end up just squinting, so to speak, at distant data long past; and these data are summarized every day by the Chicago Board Options Exchange (CBOE) and freely available to everyone.
We note the “Market Price of Risk” (which we are about to define and it is a “price” rather than a ratio or a volume) is yet another example of a “risk adjusted price” of Sharpe-Markowitz type:
“Market Price of Risk” = SF = [#Put Options/# Call Options] × S&P 500 Index = [P/C] × SP
where SP is the value of a market index; and [P/C] = [Daily #Put Options/# Call Options] is the quadratic (or power) mean of the ratio of the daily options volumes in puts and calls; the strike prices don’t really matter although we could weight them by their “worth” (#Put Options × Cost of Option), at each strike price that is demonstrated; and, similarly, for the call options; and once again, form the ratios and the “power mean” for reasons that we will explain below (please see “The Market Power” below).
The reason that it doesn’t matter how we form the ratios, is that the cost of the call options will almost always be higher than the cost of the put options, for the same “money-ness” (please see below) and therefore, “costs” will tend to drag the ratio based on counting (just the numbers) more down, favoring the calls, and less up, handicapping the puts, in a more exaggerated fashion for the same numbers of puts and calls, respectively. Although one could also imagine a market in which puts tended to be cheaper than calls for the same “money-ness”, and one sometimes sees that for individual equities.
We can expect to more effectively measure investor expectations if we use “money-ness” as the common factor, and further restrict the numbers of puts and calls to “equal money-ness” so that the price factor just drops out, and we are again reduced to the numbers factor as above, and it measures the same thing.
Nevertheless, the more complicated measure that would use the differences between the strike prices and the actual stock prices, a positive difference for the calls, and the stock price less the put price for the puts (again, a positive price), could be used to systematically incorporate the effect of the “volatility smile” that is endemic to the market pricing of options using the Black & Scholes Option Pricing Model.
We have found that using the daily option traffic to infer market risk as a number, or price as indicated in Exhibit 2, doesn’t improve on the picture in Exhibit 1, of large blocks of orange to indicate where the “heaviness” is, but that it might also be more meaningful (or robust) to accumulate the option traffic over a number of days and then form the ratio and take its quadratic mean.
For that, any number of days from one to ninety can be used, but we have also found that if we use the long horizon, ninety days, then, in general, the accumulation of calls will always tend to be larger than the accumulation of puts, and, therefore, the market will always look heavy on calls and destined to go up – which is probably true, but we don’t know when as hope springs eternal.
We can discount the speculators who have short horizons and not a lot of money (therefore, they don’t need puts to protect their non-existent long positions), by using a number of days between fifteen and sixty, and we have found that forty-five days is helpful (please see Exhibit 2 above) and also corresponds to roughly the number of days half-way to an option horizon of three months, which is most often useful to us in our defense of stock prices.
Another Oskar (Morgenstern) Winner
With SF so-defined, [P/C] is a measure of “risk aversion” – because the higher it is, the more likely it is that investors are buying protective puts (absent the odd hedge fund that is shorting the market and also buying puts to “protect” themselves from themselves) – and SP is the “market price”, and the difference:
U = SP – SF = SP × (1 – [P/C])
is a utility function of von Neumann-Morgenstern type (please see our Post, The Price of Risk, August 2012, for additional references).
We can say, then, that a current market “price” or index, SP, has “positive utility” if it exceeds the “risk adjusted price”, SF, and “negative utility” otherwise; or, more colorfully, that the current price, SP = U/(1-[P/C]), or “value of the market”, is the “expected future value” of the “current market utility”, U, with all the hopes and fears that utility might embrace. Although “positive utility” sounds good, in economics, it’s a “free good” and begs to be eliminated.
The Market Power
Another interesting way to look at this equation, SP= U/(1-[P/C]), is as a “power series” in which the factor [P/C] is repeatedly applied to the current utility, U, of the market, figuratively, in steps, and as the ratio [P/C] unfolds, and takes new values every day, but unfolds slowly from the current value:
“Market Power” = U/(1-[P/C]) = U × (1 + [P/C] + [P/C]² + [P/C]³ + … )
which, if the market utility, U, is deemed to be constant as expressed, will only converge if the balance of puts to calls, [P/C], tends to be less than one, [P/C]<1, and, therefore, that the investors continue to invest and remain positive (by tending to buy more calls than puts, or fewer puts than calls, a distinction that depends on the level of “exuberance”) with respect to the market utility in comparison to, for example, fixed income investments in bonds; in general, however, U is not constant and is an “externality”, O’ye of little faith, and anything can happen if it is not anticipated by the evolving ratios, [P/C].
Because the equation, when represented in closed form, SP = U/(1-[P/C]) always exists absent the situation that might be represented by 1 = [P/C] in which the market doesn’t show any inclination to change, we must have that the utility of the market, U, is declining as the ratio of puts to calls increases above one; and, on the other hand, U could be increasing as the ratio declines to below one, and there is an excess of calls. That sounds pretty powerful to us, and we don’t have to rely on the past to give us some new insight into the future.
The Price of Risk
The calculated Risk Price (SF) is a provably effective estimate of the “price of risk” which is “the least stock price at which the company is likeable” (Goetze 2009) and “likeability” is determined by the demonstrated factors of “risk aversion” – we want to keep our money and obtain a hopeful return above the rate of inflation – and the properties of portfolios of such stocks.
Stock prices that are less than the price of risk can be said to be “bargain prices” but with the risk attached that the company might never get a higher price other than that due to ambient volatility or “surprise”; on the other hand, investors who are willing to pay the “full price” above the price of risk, and buy and hold the stock at those prices, must also be confident, and have reason to believe, that the company will produce those values, absent new information.
Please see our Posts, The Price of Risk, August 2012 and The Nash Equilibrium & Its Stock Price, October 2012, for more information on the theory.
To see what else “risk averse” investing can do for us, please see our recent Posts, The Wall Street Put, April 2013, and earlier Posts such as The Dow Transports, March 2013, or The Risk Adjusted Dow, March 2013, or The Canada Pension Bond, February 2013, and for a more colorful description of investment risk and the application of the “price of risk” to mergers & acquisitions, please see our Post, Bystanders & Collateral Damage, April 2013.
Postscript
We are The RiskWerk Company and care not a jot for mutual funds, hedge funds, “alternative investments”, the “risk/reward equation” and every other unprovable artifact of investment lore. We have just one product
The Perpetual Bond™
“Alpha-smart with 100% Capital Safety and 100% Liquidity”
Guaranteed
With No Fees and No Loads on Capital
For more information on RiskWerk, please follow the Tags or Categories attached to this Letter or simply enter Search for additional references to any term that we have used. Related data may be obtained from us for free in a machine readable format by request to RiskWerk@gmail.com.
Disclaimer
Investing in the bond and stock markets has become a highly regulated and litigious industry but despite that, there remains only one effective rule and that is caveat emptor or “buyer beware”. Nothing that we say should be construed by any person as advice or a recommendation to buy, sell, hold or avoid the common stock or bonds of any public company at any time for any purpose. That is the law and we fully support and respect that law and regulation in every jurisdiction without exception and without qualification to the best of our knowledge and ability. We can only tell you what we do and why we do it or have done it and we know nothing at all about the future or the future of stock prices of any company nor why they are what they are, now. The author retains all copyrights to his works in this blog and on this website. The Perpetual Bond®™ is a registered trademark and patented technology of The RiskWerk Company and RiskWerk Limited (“Company”) . The Canada Pension Bond®™ and The Medina Bond®™ are registered trademarks or trademarks of the Company as are the words and phrases “Alpha-smart”, “100% Capital Safety”, “100% Liquidity”, ”price of risk”, “risk price”, and the symbols “(B)”, “(N)” and N*.
