(B)(N) BBY Best Buy Company Incorporated
Deal Book. Retailers are having a tough time on Main Street and on Wall Street as consumer tastes and preferences take advantage of the new technologies and the old loyalties fade. The electronics retailer BBY Best Buy Company Incorporated is a valiant player (The Associated Press, January 11, 2013, Best Buy shares rise after holiday sales come in better than expected) but the company is also dwarfed by the AMZN Amazon.com juggernaut (please see Exhibit 1 and 2 below and our earlier Posts on companies such as Target, Sears, Canadian Tire, Loblaws and the recently emerged new Hudson’s Bay Company among others) and, of course, many retailers, big box stores, the manufacturers themselves, and mom & pop shops on every corner sell and service the same goods.
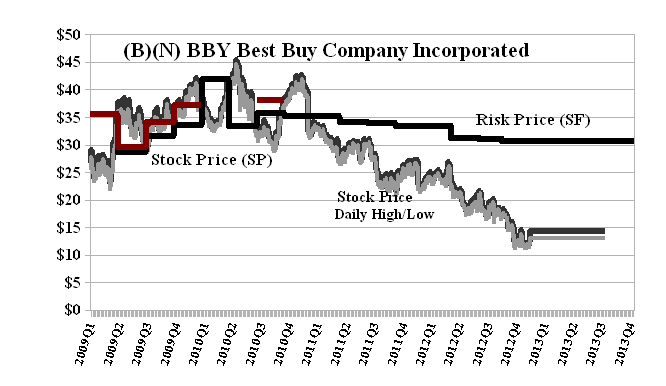
The Best Buy Company is headquartered in Richfield, Minnesota and acquired the Canadian-based Future Shop for $580 million in 2001 and still runs over 140 stores under that brand. Best Buy pays a dividend of $0.68 per share or $230 million per year for a current yield of 4.8% which is quite high but the current stock price is $14 and down significantly from $40 two years ago and it is trading well below the current Risk Price (SF) of $34 (please see Exhibit 1 below). The stock is not only in the volatility zone (N) of investor uncertainty but also trading at prices that are well below those of just two years ago in 2010 and early 2011 and one wonders why the next stop might not be zero.
Exhibit 1: (B)(N) BBY Best Buy Company Incorporated – Risk Price Chart
Best Buy Company Incorporated is a multinational retailer of consumer electronics, computing and mobile phone products, entertainment products, appliances and related services.
(Please Click on the Chart to make it larger if required.)
It is rumoured that the co-founder Richard Schulze might make a bid to buy the whole Company. Nothing material has come forth but the Risk Price (SF) of $34 would suggest that a cash deal of $11 billion is called for even though that is well above the current market value of $4.8 billion (and we have just wondered why it is not zero). There are two reasons that one could argue for that price. The company has total assets of $17.5 billion, shareholders equity of $3.5 billion, current inventories of $8.1 billion and net fixed assets of $3.4 billion with an accumulated depreciation of $4.8 billion, and total liabilities of $14 billion which also describes the company (in balance sheet terms) in 2010 at stock prices between $33 and $38 and a Risk Price (SF) of $35. Should one now pay less for the same thing two years later or is there a reason to suggest that it is not the same thing?
Secondly, the calculated Risk Price (SF) is a provably effective estimate of the “price of risk” which is “the least stock price at which the company is likeable” (Goetze 2009) and “likeability” is determined by the demonstrated measures or factors of “risk aversion” – we want to keep our money and obtain a hopeful return above the rate of inflation. Stock prices less than the price of risk are “bargain prices” but with the risk attached that the company might never get a higher price even if the company is able to actually produce its worth as an economic good (please see our Posts, The Price of Risk, August 2012 and The Nash Equilibrium & Its Stock Price, October 2012). On the other hand, those who are willing to pay the “full price”, so to speak, must also be confident that they will be able to produce those values under the new management (if new management or new ideas are called for) and as the owner/managers, they are basically indifferent to the future stock price (although that is generally not the motivation of “alternative investments”, acquisition or hedge fund buyers).
In contrast, Amazon.com has a balance sheet similar in structure to that of Best Buy’s (please see below) but a current market value of $120 billion or more than twenty times that of Best Buy and has never paid a dividend. Moreover, the stock price has, for the most part, traded at the “price of risk” or Risk Price (SF) (please see Exhibit 2 below) indicating that investors are “satisfied” that Amazon is producing and continues to be capable of producing what they deem to be its “economic worth” where we note (again) that “capital safety” and a hopeful return above the rate of inflation are the primary concerns of risk averse investors.
Exhibit 2: (B)(N) AMZN Amazon.com Incorporated – Risk Price Chart

Amazon.com Incorporated serves consumers through its retail websites and focuses on selection, price, and convenience. The Company’s products include books, music, computers, electronics, home and garden, and numerous other products.
(Please Click on the Chart to make it larger if required.)
And, Amazon.com has only one location – a computer complex in Seattle, Washington – although undoubtedly there are facilities for physical inventories of sold goods and for packaging and shipping them (in contrast to Best Buy which has goods for sale, essentially cash and carry, so to speak). Amazon has total assets of $23 billion, shareholders equity of $7.5 billion, inventories of $5.1 billion and net fixed assets of $5.7 billion and an accumulated depreciation account of $1.4 billion, and total liabilities of $15 billion at the present time.
One can’t help but notice that Amazon’s balance sheet is roughly twice that of Best Buy but the market values (“stock prices”, actually, because Amazon has about 450 million shares outstanding and Best Buy has about 340 million shares outstanding) differ by a factor of twenty or more. How does one explain that? The answer is that “stock prices” are not determined by “fundamental values” or “earnings” (please see our Post, The Active Investor (DOA), November 2012) but by investors who are buying and selling the stock to each other in the secondary market and their motivations, needs and aspirations can be quite different and different at different times that are not predictable. In broad terms, we can say that “speculators” buy in (N) (and might do quite well if an (N) becomes a (B)) and risk averse investors buy only in (B) and their expectation is capital safety and a hopeful return above the rate of inflation.
Postscript
We are The RiskWerk Company and care not a jot for mutual funds, hedge funds, “alternative investments”, the “risk/reward equation” and every other unprovable artifact of investment lore. We have just one product
The Perpetual Bond™
“Alpha-smart with 100% Capital Safety and 100% Liquidity”
Guaranteed
With No Fees and No Loads on Capital
For more information on RiskWerk, please follow the Tags or Categories attached to this Letter or simply enter Search for additional references to any term that we have used. Related data may be obtained from us for free in a machine readable format by request to RiskWerk@gmail.com.
Disclaimer
Investing in the bond and stock markets has become a highly regulated and litigious industry but despite that, there remains only one effective rule and that is caveat emptor or “buyer beware”. Nothing that we say should be construed by any person as advice or a recommendation to buy, sell, hold or avoid the common stock or bonds of any public company at any time for any purpose. That is the law and we fully support and respect that law and regulation in every jurisdiction without exception and without qualification to the best of our knowledge and ability. We can only tell you what we do and why we do it or have done it and we know nothing at all about the future or the future of stock prices of any company nor why they are what they are, now. The author retains all copyrights to his works in this blog and on this website. The Perpetual Bond®™ is a registered trademark and patented technology of The RiskWerk Company and RiskWerk Limited (“Company”) . The Canada Pension Bond®™ and The Medina Bond®™ are registered trademarks or trademarks of the Company as are the words and phrases “Alpha-smart”, “100% Capital Safety”, “100% Liquidity”, ”price of risk”, “risk price”, and the symbols “(B)”, “(N)” and N*.
