(P&I) The God Stock (Econo-speak)
Drama. Economists believe that there is only one stock in the World. We’ll call it “The God Stock”, the mother of all stocks, so to speak, and it is described by the stochastic differential equation:
dXt/Xt = μ dt + σ dWt
where Xt is the stock price of “The God Stock” at time t and the constant µ is an expected return that is expected with constant volatility σ; and Wt is a Wiener Process, usually called a Random Walk or Brownian Motion, that is used to explain why the observed stock price is never the same as the stock price that is predicted by this equation.
Long Term Capital Management (LTCM)
$1 to $4 in Four Years and $0 in Two Months
Nevertheless, the theory is beguiling and there are many economists who are held in its thrall, as well as legions of their students, disciples and acolytes on Wall Street, and in every village, town and city throughout the World; and the well-known company, Long Term Capital Management (LTCM), hammered the theory and the risk/reward equation for all its worth, for four years, and then the theory hammered back for two months and took it all away and there was nothing that they could do about it.
Unabashed, and still faithful, economists are continuing to work on the model, allowing, for example, that µ=µ(t) might “drift” and that σ=σ(X,t) is itself a random variable, possibly with a Lévy Distribution (they think).

Pipe Dreams
“Perfection”
Moreover, they say that the basic model would be fine and regulate or stabilise the markets if the markets, that is, we investors, were more efficient and better informed so that arbitrage was banished; and that stock prices did not have jumps but were mathematically continuous and, therefore, infinitely divisible; and that the markets should be complete and allow equities and fixed income investments in any proportion; and that there should be no friction, that is, transactions costs should be zero or negligible, and we can lend and borrow as much money as we want at reliable rates of interest.
Perhaps we should take a closer look at what they’re talking about because they certainly have the ear of regulating governments, and most of our money is managed as “God Stocks” in pension plans, and endowment and trust funds.
The basic model can be integrated in closed form by using the Itô Calculus (1944), or it can be integrated numerically by relying on the Riemann-Stieltjes integral (1894) with due consideration that each dWt = Wt – Ws, for small t-s tending to zero, is a normally distributed random variable with mean zero and variance t-s and that successive intervals are statistically independent. Please see Exhibit 1 below.
Exhibit 1: The God Stock with µ=20%, σ=30% per year, and a current price of $60


To the untrained eye, these certainly could be “stock prices” but there are a number of reasons that they cannot be “stock prices“.
Each chart has the “price” of two “God Stocks” on it and the lines and shading of each stock show the daily maximum and minimum prices obtained by sampling twenty times a day over four hundred days.
And, more importantly, they all have the same expected return and the same constant volatility and a starting price of $60.
If we generate enough of them, we can expect to cover a “box” between $45 and $75, respecting the mean and volatility, with a contour that yields slices of a normal distribution with mean at $60 (zero mean in Wt, the Wiener Process) and standard deviation that is proportional to √t with t in units of years.
(Please Click on the Chart to make it larger if required.)
That doesn’t mean, however, that the prices will stay in the box. Please see Exhibit 2 below.
Exhibit 2: Surprise! Is Not An Option


Surprise! Is Not An Option
Pearl Harbor 1941
As investors, this is not what we want.
What we want is that our money is safe – 100% capital safety – and that we might obtain a hopeful return above the rate of inflation.
Rolling the dice is not going to get that for us, except by accident; and if it does, why should we expect to keep it?
And if it doesn’t, when will we get it back, and how should we expect to do that if we’re just as helpless as before?
(Please Click on the Chart to make it larger if required.)
To look at a real stock, we chose CAT Caterpillar Corporation, which also has a price of about $60 and reasonably expected return of 20% and demonstrated volatility of 30% per year. Please see Exhibit 3 below.
Exhibit 3: (B)(N) CAT Caterpillar Incorporated – Risk Price Chart
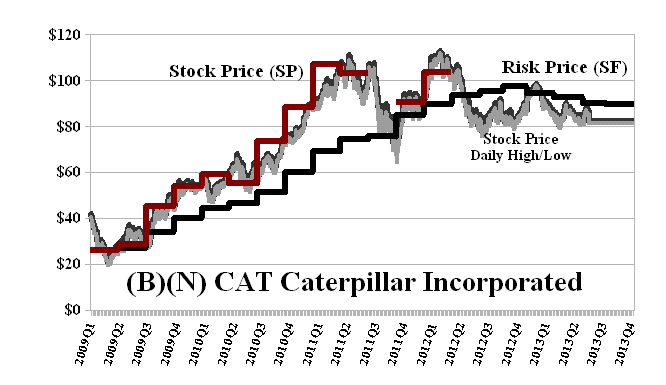
The chart shows the daily prices, high and low, and we only buy or hold the stock if the ambient stock price, Stock Price (SP) (Red line, a step-function), is at or above the price of risk, Risk Price (SF) (Black line, also a step-function).
(Please Click on the Chart to make it larger if required.)
Unlike the God Stock, the stock price demonstrates a memory and we have a reason to own it or not to own it. To see the difference more clearly, we can compare the “pull backs” which are the returns post any demonstrated price. For example, in the case of Caterpillar, please see Exhibit 4 below.
Exhibit 4: CAT Caterpillar Incorporated – Pull Back log(Xt/Xt+s)
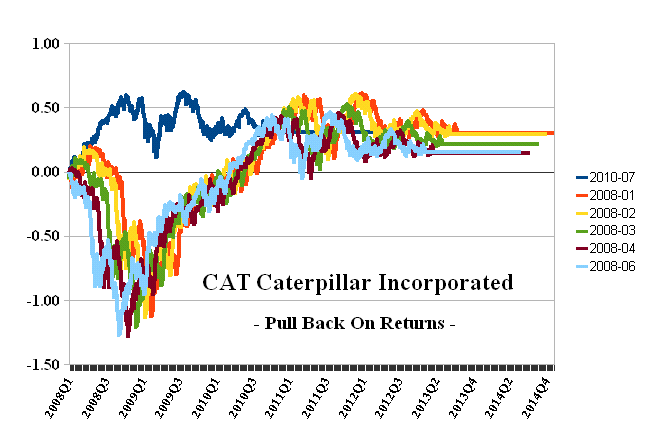
The colored lines show the evolution of the known future prices against any demonstrated price.
For example, the dark blue line at the top is the log ratio of prices post the closing price in July, 2010, and the others are a series from the first six months of 2008 through to 2010 and later, all brought back to the initial point at 0=log (Xs/Xs).
(Please Click on the Chart to make it larger if required.)
Exhibit 5: Pull Backs of the God Stock
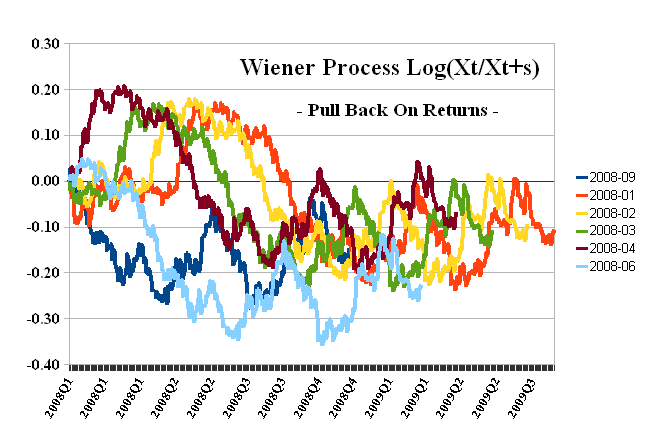
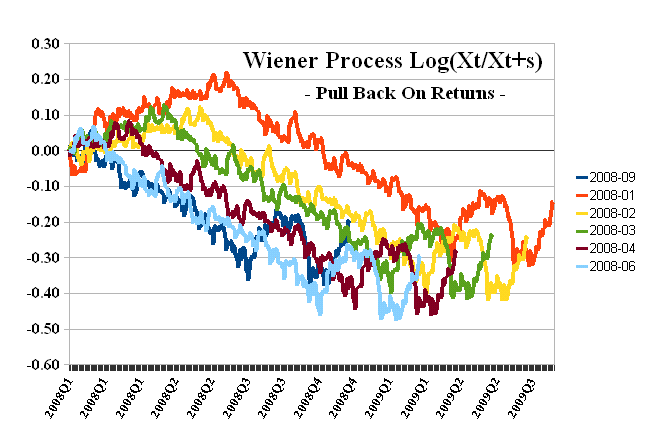
In contrast, the pull-backs of the God Stock look like just another Wiener Process.
(Please Click on the Chart to make it larger if required.)
Postscript
We are The RiskWerk Company and care not a jot for mutual funds, hedge funds, “alternative investments”, the “risk/reward equation” and every other unprovable artifact of investment lore. We have just one product
The Perpetual Bond™“
Alpha-smart with 100% Capital Safety and 100% Liquidity”
Guaranteed
With No Fees and No Loads on Capital
For more information on RiskWerk, please follow the Tags or Categories attached to this Letter or simply enter Search for additional references to any term that we have used. Related data may be obtained from us for free in a machine readable format by request to RiskWerk@gmail.com.
Disclaimer
Investing in the bond and stock markets has become a highly regulated and litigious industry but despite that, there remains only one effective rule and that is caveat emptor or “buyer beware”. Nothing that we say should be construed by any person as advice or a recommendation to buy, sell, hold or avoid the common stock or bonds of any public company at any time for any purpose. That is the law and we fully support and respect that law and regulation in every jurisdiction without exception and without qualification to the best of our knowledge and ability. We can only tell you what we do and why we do it or have done it and we know nothing at all about the future or the future of stock prices of any company nor why they are what they are, now. The author retains all copyrights to his works in this blog and on this website. The Perpetual Bond®™ is a registered trademark and patented technology of The RiskWerk Company and RiskWerk Limited (“Company”) . The Canada Pension Bond®™ and The Medina Bond®™ are registered trademarks or trademarks of the Company as are the words and phrases “Alpha-smart”, “100% Capital Safety”, “100% Liquidity”, ”price of risk”, “risk price”, and the symbols “(B)”, “(N)” and N*.
