S&P TSX Winners & Losers
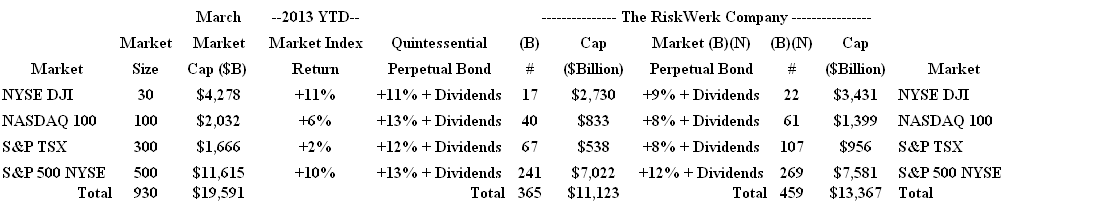
Drama. The S&P TSX has returned only +2% so far this year in contrast to New York which is tending to do double digits (please see Exhibit 1 below and our recent Post, O’the Slings And Arrows Of Outrageous Fortunes, March 2013, for a brief summary of the four major New York and Toronto markets).
Exhibit 1: From O’the Slings & Arrows of Outrageous Fortunes – March 2013
(Please Click on the Chart to make it larger if required.)
What do the investors want? And if prices are low in Toronto, would this not be a good time to buy something? And if prices are high in New York, should we not sell something? The answers are: (1) investors want 100% capital safety and a hopeful return above the rate of inflation, or, equally correctly, they don’t really know what they want, that is, they’re gamblers not because of what they want – which is probably more money rather than less – but because they don’t know how to get it except by taking a chance; and (2) yes, we should think about buying something, but we should not buy it just because it has a low price – after all, the stock market is not the Dollar Store, and “low prices” do not mean “good value”; and (3) yes, we should think about protecting our prices, and, if we can’t do that, then maybe we should think about taking profits (but please see our Posts, Volatility for the Delta Challenged, or Run, Rabbit! Run, June 2012).
Today’s news on the morning wire is not helpful in divining the future because the news reporters can only tell us what happened yesterday, and shouldn’t even try to tell us what might happen today or tomorrow (Reuters, April 1, 2013, TSX drops as gold miners continue their fall) and so we learn that resource stocks are not in demand right now, and, anyway, “cyclicals are hated across the globe”; there is slowing manufacturing activity in the U.S. which casts a pall on our railroads (of which there are only two); and, there are “modest gains in (some) heavyweight energy and banking stocks”. And if we have learned something from the news that is actionable in the stock market, then we are gamblers, which is OK (and sometimes works) but we ought to know that we’re gambling and that we have no vested interest in the outcome, except our money, which we might not get back.
In contrast, we can take matters into our own hands and observe that there are 56 companies in the S&P TSX with a market capitalization of $2 billion or more, and returns of less than 2%, or negative, since December, and they have, in aggregate, lost minus (5%) so far this year (please see Exhibit 2 below). Of those, 16 companies (or less than 25%) are eligible for the Perpetual Bond™, that is, the ambient stock prices are still trading at or above the price of risk or the Risk Price (SF), and these have lost minus (4%) since the beginning of year. However, those are “paper losses” because of our usual policy of “price protection” (please see the following) prevents them from becoming “actual losses”. Please see Exhibit 2 and 3 below.
Exhibit 2: S&P TSX Losers ($000) – Cash Flow Summary – March 2013

(Please Click on the Chart to make it larger if required.)
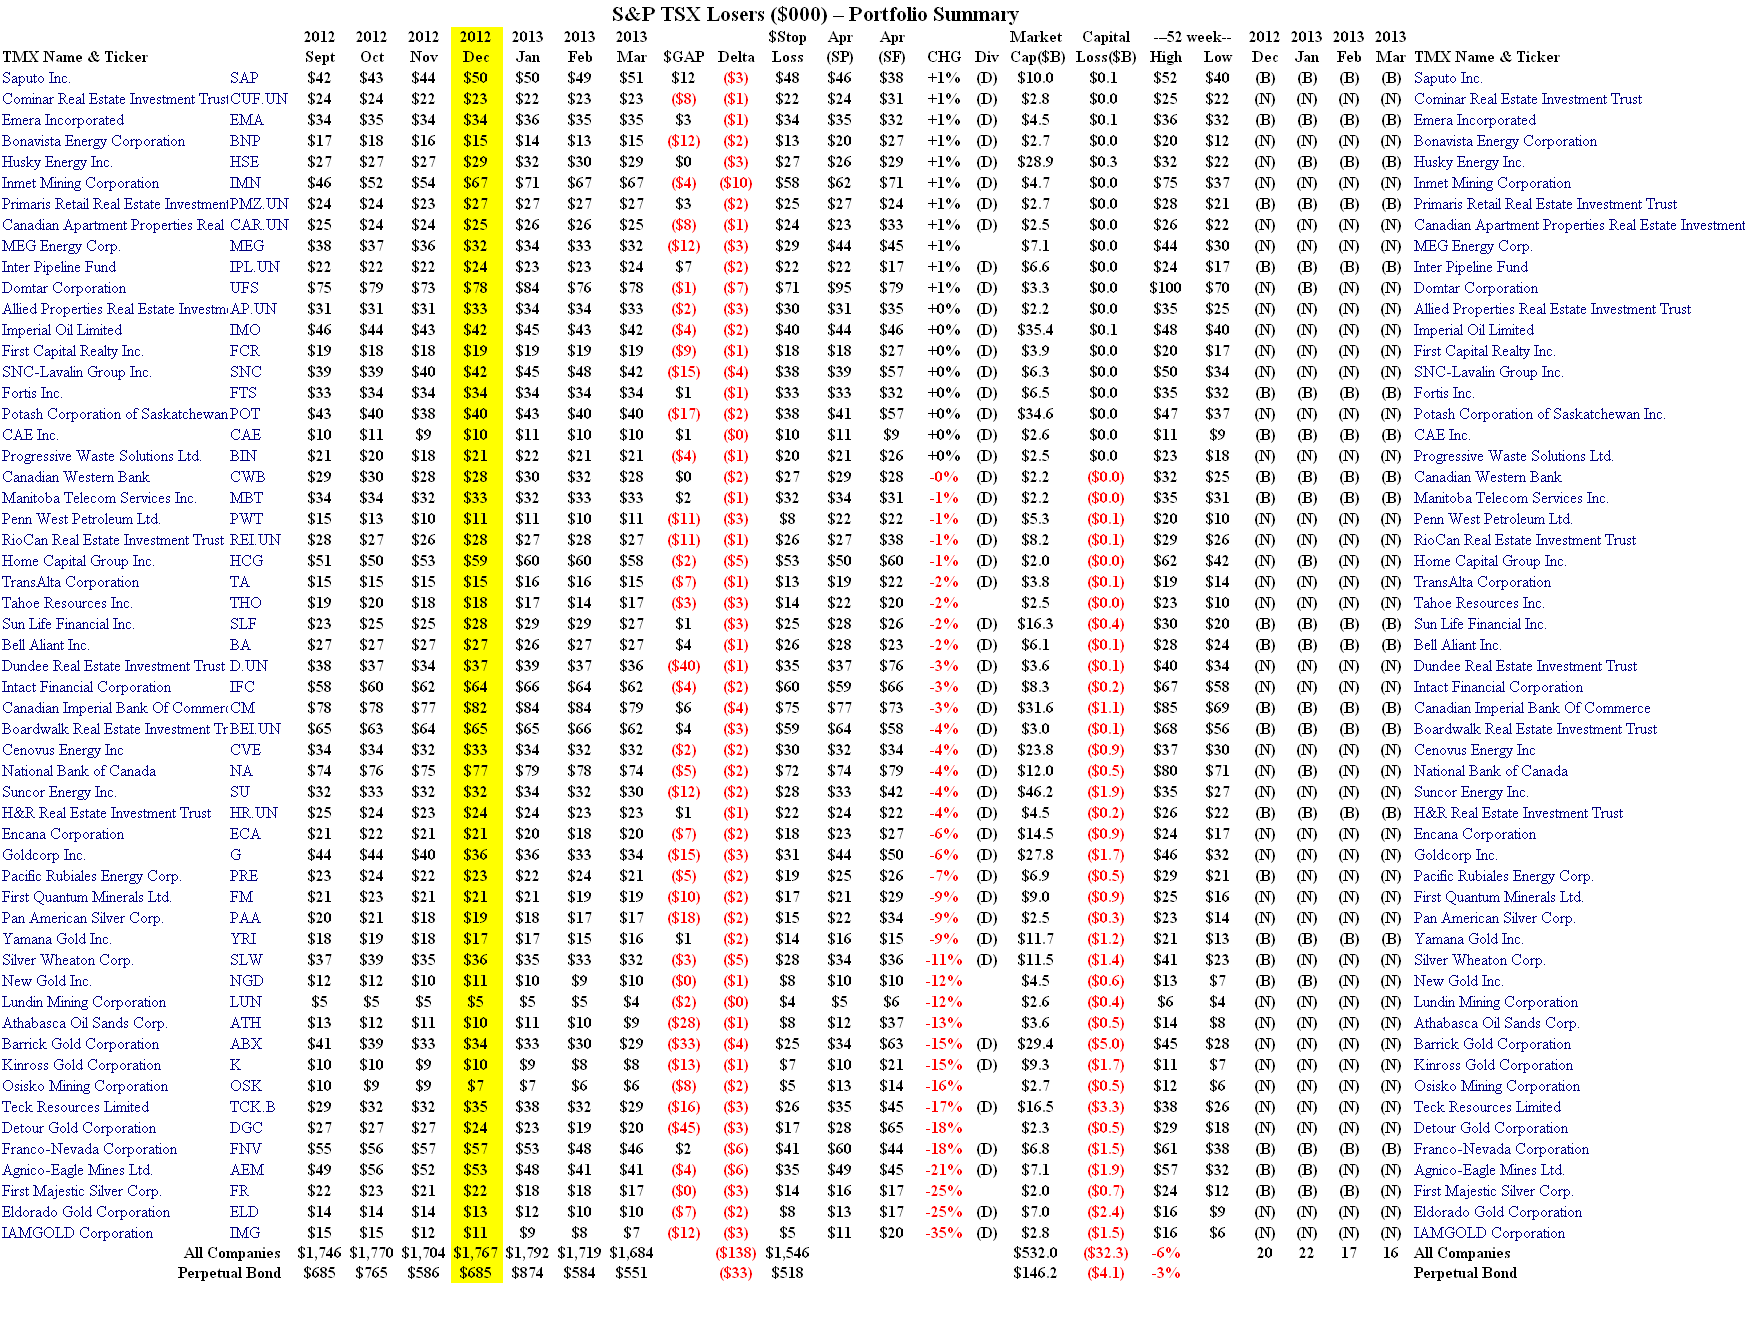
Exhibit 3: S&P TSX Losers ($000) – Portfolio Summary – March 2013
(Please Click on the Chart to make it larger, and again, if required.)
We can see from the Chart (Exhibit 3 above), that most of the biggest losers since December (in excess of minus (6%)) are in the golds, beginning with Goldcorp Incorporated which has a market capitalization of $27.8 billion and is down minus ($1.7 billion) since December. Of these, only Yamana Gold Incorporated and the Franco-Nevada Corporation are in the Perpetual Bond™ (please see our Post on the GLD SPDR Gold Trust in Extraterrestrial Funds, March 2013, for more information on the golds) and the Perpetual Bond™ is down minus (3%) (which is a “paper loss” until we actually “sell” them in some way) in contradistinction to all the companies in the Losers List that are down minus (6%) for an aggregate loss of $32.3 billion. If we are buying “losers”, then it would only be the (B)’s that we are buying, and there are currently sixteen of those, but we’re not buying any of the (N)’s because we have no insight into their future prospects.
For example, consider the plight of ATH Athabasca Oil (Sands) Corporation which has a current stock price of less than $9 and is close to its all time low of $8, and it has a Risk Price (SF) of $37 (Exhibit 4 below) which is way above the current stock prices and has never been obtained before. The reason that the Risk Price (SF), which is a calculation not a guess, is so high relative to the stock price is that the company made massive investments in fixed assets (new plant & equipment and investments in conventional oil & gas reserves) beginning in 2011 that have not paid off, as yet, and anyone who is willing to acquire the company, at any price, would have to have a compelling vision of future production and sales that would earn that price ($37 per share).
Exhibit 4: (B)(N) ATH Athabasca Oil (Sands) Corporation – Risk Price Chart
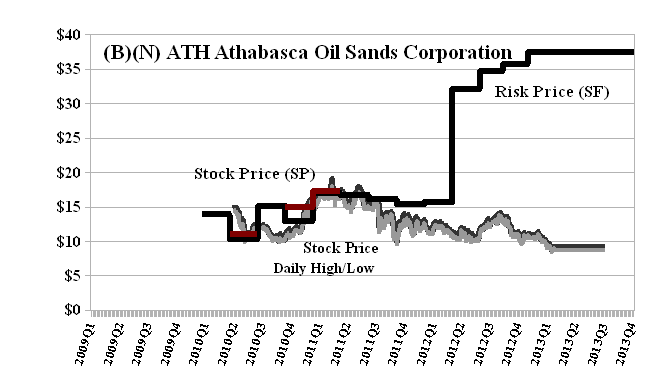
Athabasca Oil Corporation (formerly Athabasca Oil Sands Corporation) is in business to explore for, sustainably develop and produce bitumen and oil and gas assets in Alberta, Canada.
(Please Click on the Chart to make it larger if required.)
We note, in passing, that Athabasca has never paid a dividend to its shareholders and has an expected downside volatility of minus ($1) and a stop/loss price of $8; the July put at $8 costs $0.42 today and an offsetting sold or short call at $9 (against our long position, if we had one) sells for $0.72, so that for a cost of $8 per share and a gain of $0.30 per share on the “collar” ($0.42 less $0.72), we could “take a chance” for the next three months at between $8 and $9 per share.
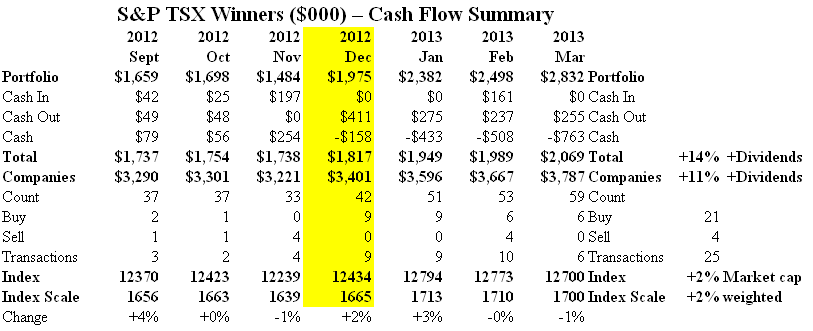
On the other side of the ledger, there are 81 companies with a market capitalization of $2 billion or more, and returns in excess of +2% since the beginning of the year, and, in aggregate, they have returned +11% since the beginning of the year, and of those, 59 (or 75% of them) are currently in the Perpetual Bond™ and they have returned +14% (plus dividends) since the beginning of the year. And those are “realizable profits” and cannot be less than that for the rest of the year because our usual policy of “price protection” requires that we have an effective and advantageous “stop/loss”, or that we set a “collar” on the stock prices, or that we sell and take profits if we can’t do either or just need some money. Please see Exhibit 5 and 6 below. We also note that, with respect to the returns in Exhibit 6 (bottom line) which differ from those in Exhibit 5 (based on price changes), that the changes in market capitalization, encompassing both price changes and the common shares outstanding, are +6% for all of the companies, and +10% for the Perpetual Bond™, respectively, and, therefore, “weighting by market capitalization” has a significant deleterious effect in this case (and, in general, makes no sense at all, except to support our brokers).
Exhibit 5: S&P TSX Winners ($000) – Cash Flow Summary – March 2013
(Please Click on the Chart to make it larger if required.)
Exhibit 6: S&P TSX Winners ($000) – Portfolio Summary – March 2013

(Please Click on the Chart to make it larger, and again, if required.)
With gains in excess of +15% in three months in nearly 1/3rd of these companies, should we not “take profits” and celebrate our “good fortune”? The answer is, no, luck has nothing to do with it, and, with reasonable care, our profits cannot be less than this for the rest of year.
For example, the Methanex Corporation is up +30% since the beginning of the year and is trading well-above its current Risk Price (SF) of $28 (please see Exhibit 7 below). The company pays a dividend of $0.185 per share per quarter, or $70 million per year to its shareholders for a current yield of 1.8% which is comparable to the rate of inflation. The current stop/loss price is $37 reflecting a volatility loss of minus ($4) per share, to which we could be indifferent since we bought the stock at $28 in early 2012, more than a year ago; but the October put at $38 costs $2.25 today and an offsetting sold or short call at $44 against our long position, sells for $1.87, so that for a net cost of $0.38 per share ($2.25 less $1.87, which is less than 1% of the current stock price), we could keep the stock for the next six months, collect our dividends, and be assured of a price of no less than $38 and no more than $44, unless we roll the options in the meantime.
Exhibit 7: (B)(N) MX Methanex Corporation – Risk Price Chart
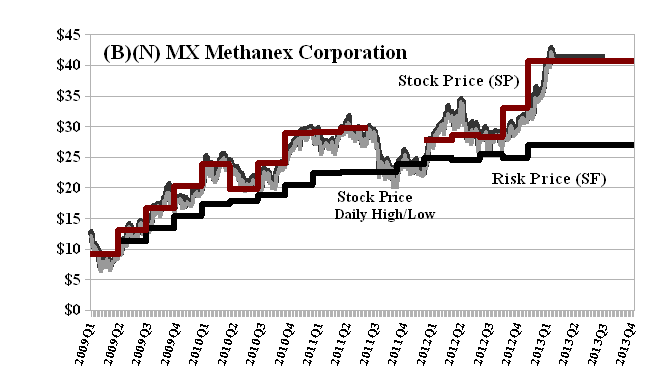
Methanex Corporation produces and markets methanol, a chemical that is used to make a range of industrial, consumer and energy products.
(Please Click on the Chart to make it larger if required.)
The Perpetual Bond™ is called “perpetual” because as long as there are viable equity markets anywhere, we can expect that there will be companies that are trading at or above their price of risk, which we calculate from current balance sheets as the Risk Price (SF); secondly, companies that enter the Perpetual Bond™ tend to stay in the bond for long periods of time, typically, fifteen months or more; thirdly, the price of risk is the stock price at which there is a Nash Equilibrium between “risk seeking” and “risk averse” investors who have demonstrated a willingness to buy and hold the stock at those prices because they believe that the company will eventually earn them, or better. Finally, the Perpetual Bond™ is a “bond” in the sense of “troth” – we enforce 100% Capital Safety.
Please see our Posts, The Price of Risk, August 2012, and The Nash Equilibrium & Its Stock Price, October 2012, for more information. These data may be obtained from us for free in a machine readable format by request to RiskWerk@gmail.com.
Postscript
We are The RiskWerk Company and care not a jot for mutual funds, hedge funds, “alternative investments”, the “risk/reward equation” and every other unprovable artifact of investment lore. We have just one product
The Perpetual Bond™
“Alpha-smart with 100% Capital Safety and 100% Liquidity”
Guaranteed
With No Fees and No Loads on Capital
For more information on RiskWerk, please follow the Tags or Categories attached to this Letter or simply enter Search for additional references to any term that we have used. Related data may be obtained from us for free in a machine readable format by request to RiskWerk@gmail.com.
Disclaimer
Investing in the bond and stock markets has become a highly regulated and litigious industry but despite that, there remains only one effective rule and that is caveat emptor or “buyer beware”. Nothing that we say should be construed by any person as advice or a recommendation to buy, sell, hold or avoid the common stock or bonds of any public company at any time for any purpose. That is the law and we fully support and respect that law and regulation in every jurisdiction without exception and without qualification to the best of our knowledge and ability. We can only tell you what we do and why we do it or have done it and we know nothing at all about the future or the future of stock prices of any company nor why they are what they are, now. The author retains all copyrights to his works in this blog and on this website. The Perpetual Bond®™ is a registered trademark and patented technology of The RiskWerk Company and RiskWerk Limited (“Company”) . The Canada Pension Bond®™ and The Medina Bond®™ are registered trademarks or trademarks of the Company as are the words and phrases “Alpha-smart”, “100% Capital Safety”, “100% Liquidity”, ”price of risk”, “risk price”, and the symbols “(B)”, “(N)” and N*.
