The Risk Adjusted Dow
Drama. The Dow – that is, the Dow Jones Industrial Index of thirty of America’s largest companies – is up and, at over 14,330 today, it is the highest that it’s been in five years. Our brokers have been calling us all week and saying that now is the time to buy. What? They must be confusing us with “The Investor Product” (please see our earlier Post, The Investor Product, February 2013, and Wallywood & The Baypatch, January 2013). We tried to explain to them that June 2012 was a better time to buy when the Dow was around 12,100, but we didn’t receive any calls from them then, or even that we should have loaded up on the Dow in March 2009 when it was a miserly 6,470 and again we didn’t get any calls from them then (although a lot of investors got margin calls, didn’t they). They ought to know that we’ve always been invested in the Dow (among other markets) and we don’t have any special interest in buying more of our now high-priced stocks from ourselves. Better that we think about protecting the prices that we have. (Please see Exhibit 2 and the following below.)
Every company has a “price of risk” which we usually calculate as the Risk Price (SF). (“SF” is not science fiction. “SP” was already in use.) The “price of risk” can be described in several ways. It is the “least stock price at which a company is likeable” (Goetze 2009) and the property of “likeability” (however we define it) can be verified or tested by portfolios of “likeable” stocks – that is, they should tend not to lose in value and, equally importantly, the contra portfolio of stocks that are deemed to be “not likeable” by the same rules in the same market, should tend not to gain in value. We can also show that the “price of risk” is the stock price at which a Nash Equilibrium is formed among “risk averse” and “risk seeking” investors in the same market. (Please see our Post, The Price of Risk, August 2012, and The Nash Equilibrium & Its Stock Price, October 2012, for more information.)
The “price of risk” is also a plausible or negotiable acquisition price for the whole company (please see any of the Deal Books in these Posts) and we can calculate what it would cost to buy and own all of the companies in the Dow – we would bid and argue for $3.9 trillion at the present time in contrast to a market value of $4.2 trillion today. If that purchase at the Risk Price is benchmarked to the Dow Index at it’s highest point in recent memory (investors over the age of 21) but past times, 14,165 on October 9, 2007, and it’s lowest point, 6,470 on March 6, 2009, then we obtain the Dow Index “Adjusted for Greed” and “Adjusted For Fear”, respectively. Please see Exhibit 1 below.
Our conclusion is that if the market is rational, the “market”, that is, the Dow, could go up by another 35% this year, or down minus (8%) this year from the current level. The reason is that the market will go up if all of, or more of, the 60-40 people (60% bonds and 40% equities) become 40-60 people (40% bonds and 60% equities) in deference to “greed” and shift their funds accordingly in order to catch up, and, vice versa, in deference to “fear”. However, we do not expect that the market is “rational” for investors who are “late”, and so, we allow 50% for rational behaviour on “buy and hold” and 150% for irrational or panic behaviour on “sell” which would suggest an 18% upside (50% of 35%) and a 12% downside (150% of 8%) from the current level. Moreover, as “risk averse” investors – we want to keep our money – 100% Capital Safety – and obtain a hopeful but not necessarily guaranteed return above the rate of inflation (over which we have no control or insight) – we will profit from either outcome. Please see Exhibit 2 and the following below.
Exhibit 1: The Risk Adjusted Dow (SF)
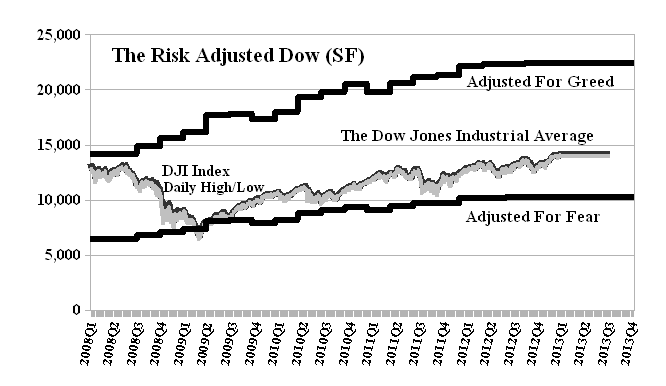
(Please Click on the Chart to make it larger if required.)
In contrast to “fear” and “greed”, the Dow denominated Perpetual Bond™ which we started in December 2011 returned +9.5% last year plus dividends of another 2% to 3% and the “core” portfolio of seventeen companies that were in the Perpetual Bond™ for all of last year plus another five companies that we bought since September has returned an additional +8.7% in the first two months of this year (January through today), and we know exactly how that was done and can reasonably expect to continue to do it for as long as there is an equity market anywhere, regardless of the Dow’s ups and downs.
The Cash Flow Summary (Exhibit 2 below) shows that we bought 1,000 shares of each of twenty-one companies (Count line) for a cash outlay of $1,296,000 in December 2011 and made a number of additional purchases and sales (in blocks of 1,000 for simplicity) in the course of the year. In early March 2013, the portfolio has twenty-two companies and is currently worth $1,531,000 (Total line which is the Portfolio line at market plus the Cash Account (the margin account, which is negative, is optional but convenient)). The Companies line shows the result of just buying all thirty of the companies and holding them without change; it cost $1,618,000 and is currently worth $1,862,000 for a +15% gain in contrast to the Perpetual Bond™ which from December 2011 through today in early March has a +18% gain. The portfolios obviously scale and buying millions of shares on the same basis is trivial in the $4 trillion market of the Dow. We expect to buy at market prices but the selling discipline is more complicated (please see Exhibits 3 and 4 below or our Post, The Wall Street Put, August 2012). It’s also noteworthy that the Dow gained +8% in the first few months of last year and then waned and waxed to produce +7% for the year. Since the end of December last, however, it’s up +9.4% and the Perpetual Bond™ is up (only) +8.7% but will not be worth less than that for the rest of the year (please see below) regardless of what happens next in the Dow. Will it be +18% or minus (12%)? We have no idea.
Exhibit 2: The Dow Perpetual Bond™ – Cash Flow Summary Since December 2011
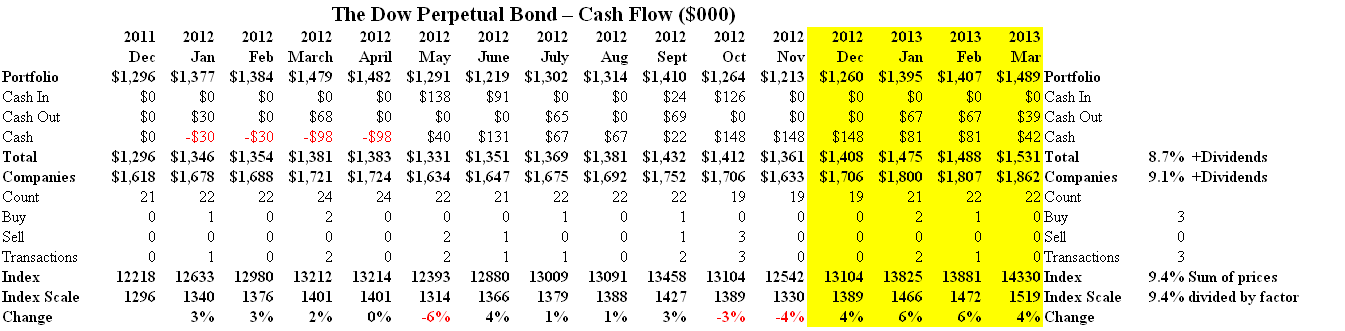
(Please Click on the Chart to make it larger, and again if required.)
Exhibit 3: The Dow Perpetual Bond™ – Portfolio Since September 2012
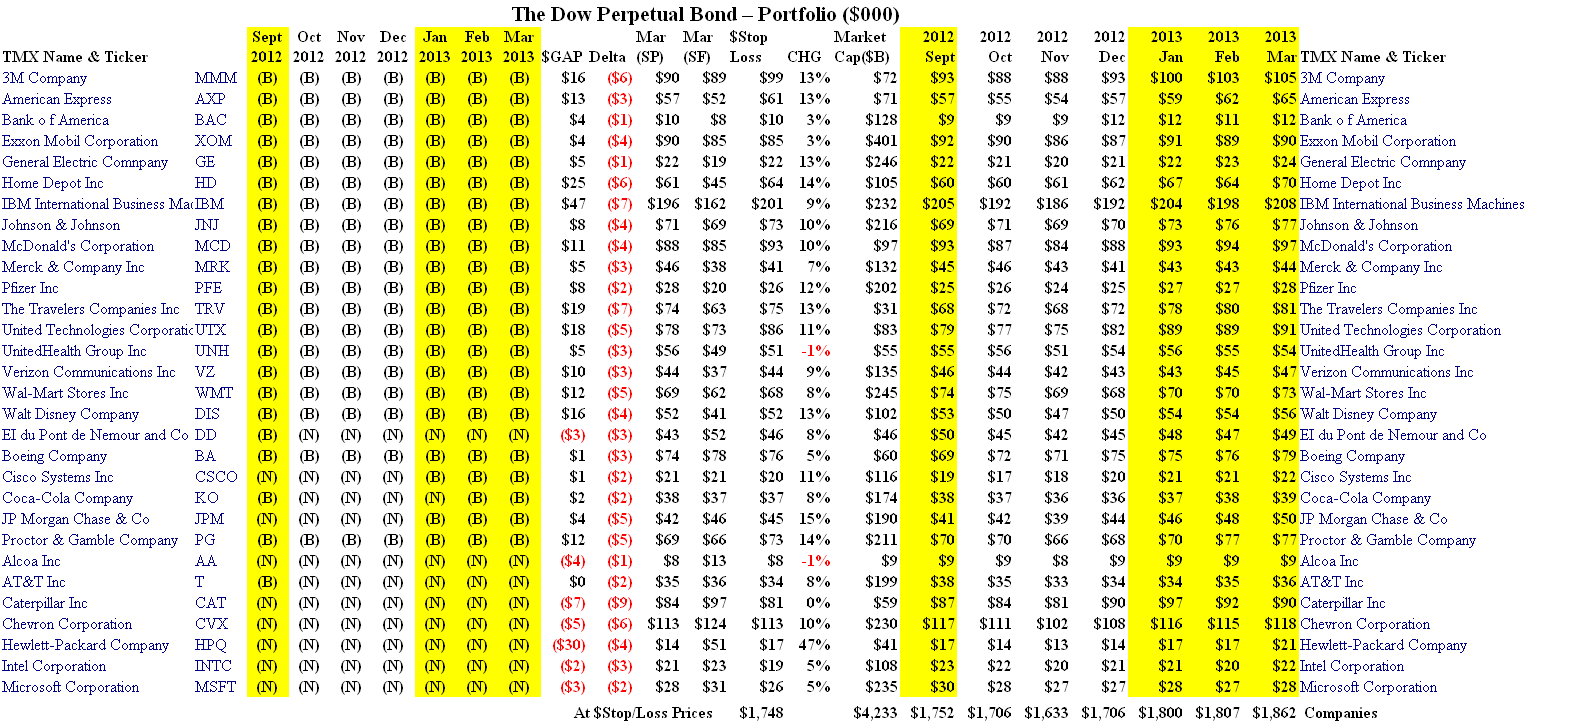
(Please Click on the Chart to make it larger, and again if required.)
The Portfolio Summary (Exhibit 2 above) shows the (B)(N)-status of each of the Dow companies currently, in early March, and since September of last year. A company is in the portfolio only if it has a (B) designation, meaning that the ambient stock prices appear to be above the Risk Price (SF), and it is an (N) otherwise. We buy on (N)- to (B)-transitions and prepare to “sell” on (B)- to (N)-transitions, and for no other reasons. The first seventeen companies (3M through the Walt Disney Corporation) were in the Perpetual Bond™ throughout all of last year and are in the Perpetual Bond™ now. The E.I. Dupont Company was also in the “bond” since December 2011 (and previously) but we sold the last of our holdings in September on a (B)- to (N)-transition, and we’ve acquired an interest in five companies since then (Boeing through Proctor & Gamble). The remaining seven companies (Alcoa through Microsoft) are not in the Perpetual Bond™ now and have not been since at least before September last.
The CHG column shows the stock price changes since the end of December 2012 (two months) and the Market Cap column shows the total market capitalization (in $Billion) of each company at the current prices. The $GAP is the difference between the current stock prices and the Risk Price (SF) (March (SF)) and the column Stock Price (SP) (March (SP)) shows the (or any) stock price when the last Risk Price (SF) was calculated and updated. The Stock Price (SP) shows the ambient prices at which the stock was bought and/or held, but it is only indicative of the selling price which is based on “stop/loss” selling or option-mandated conditions affecting the stock price at the time that it is sold (please see an example below, Exhibit 4, or almost any of the (B)(N) company Posts).
The Delta column is our estimate of the downside price change due to demonstrated volatility (please see our Post, Popoviciu’s Volatility, September 2012) and we note that if all of the stop/loss prices are activated ($Stop/Loss column) and we are “stopped out” in every case, then the portfolio is worth $1,748,000 instead of its current market value of $1,862,000. For example, the 3M Company is currently trading at $105 but the estimated downside due to volatility is minus ($6) and the $Stop/Loss price is $99. Since the company has been in our portfolio for more than a year and was acquired at prices below $84, we’re not overly concerned about being “stopped out” at $99 (if that happens) but there are also reasons to be more proactive in protecting our prices and maintaining an interest in certain of these companies despite ambient price volatility.
For example (please see Exhibit 4 below), the 3M Company was bought at $83.50 in January 2012 and has been in the Perpetual Bond™ since then. The current price is $104.50 and it pays a quarterly dividend of $0.64 per share or $1.8 billion per year to its shareholders for a current yield of 2.5%. The July put at $105 costs $3.75 per share today and an offsetting sold or short call at $110 sells for $1.50 today so that for a net cost of $2.25 per share ($3.75 less $1.50) we can lock in our price between at $105 and $110 for the next three months. Another way to look at that is that we need to sell two (or three) shares today in order to protect the price on the other ninety-eight (or ninety-seven) above $105 for the next three months while we think about what to do next.
Exhibit 4: (B)(N) MMM 3M Company – Risk Price Chart
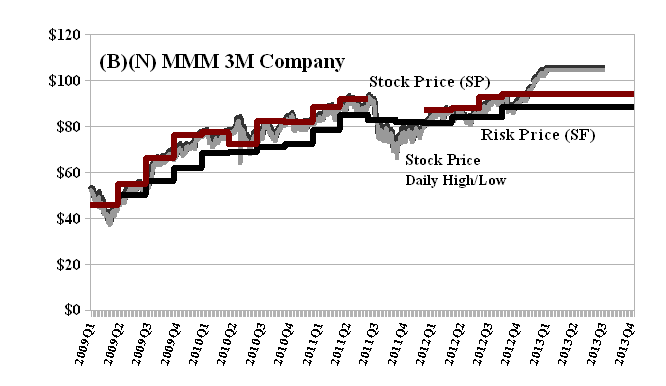
3M Company is a global technology company. Its business segments include: Industrial & Transportation; Health Care; Consumer & Office Products; Safety, Security & Protection Services; Display & Graphics; and Electro & Communications Technology.
(Please Click on the Chart to make it larger if required.)
And what’s in your portfolio? The Dow continues to rise and the World Stock markets are also up for reasons that we can’t possibly understand because they don’t make much sense and there will be a new story tomorrow or next week (The Associated Press, March 8, 013, World stock markets up after Dow hits another high; Chinese exports jump). If all you have is cash, bonds, gold and silver, et cetera, you missed it, again. Please see our Post, The Investor Product, February 2013, or Wallywood & The Baypatch, January 2013, to understand how that might happen.
Postscript
We are The RiskWerk Company and care not a jot for mutual funds, hedge funds, “alternative investments”, the “risk/reward equation” and every other unprovable artifact of investment lore. We have just one product
The Perpetual Bond™
“Alpha-smart with 100% Capital Safety and 100% Liquidity”
Guaranteed
With No Fees and No Loads on Capital
For more information on RiskWerk, please follow the Tags or Categories attached to this Letter or simply enter Search for additional references to any term that we have used. Related data may be obtained from us for free in a machine readable format by request to RiskWerk@gmail.com.
Disclaimer
Investing in the bond and stock markets has become a highly regulated and litigious industry but despite that, there remains only one effective rule and that is caveat emptor or “buyer beware”. Nothing that we say should be construed by any person as advice or a recommendation to buy, sell, hold or avoid the common stock or bonds of any public company at any time for any purpose. That is the law and we fully support and respect that law and regulation in every jurisdiction without exception and without qualification to the best of our knowledge and ability. We can only tell you what we do and why we do it or have done it and we know nothing at all about the future or the future of stock prices of any company nor why they are what they are, now. The author retains all copyrights to his works in this blog and on this website. The Perpetual Bond®™ is a registered trademark and patented technology of The RiskWerk Company and RiskWerk Limited (“Company”) . The Canada Pension Bond®™ and The Medina Bond®™ are registered trademarks or trademarks of the Company as are the words and phrases “Alpha-smart”, “100% Capital Safety”, “100% Liquidity”, ”price of risk”, “risk price”, and the symbols “(B)”, “(N)” and N*.
