What’s a girl to do?
Essay. An “investment” is just and only the “purchase of risk” and like anything else that we might want to buy, we ought to know the price of it, that is, we ought to know the “price of risk”. The “risk” is not just that the stock price might go up or down on any day – that’s only “volatility risk” and the result (or sign) of mere “haggling” or “bargaining” as tens of thousands of investors are “bidding” or “asking” for the price of stocks (or bonds) and the buyers and sellers have different motivations or needs and information or beliefs. For example, companies that don’t trade very much or have liquidity issues or are in the “pink” or “grey” sheets, tend to have zero or low volatility and could very well be priced at zero no matter how much “worth” they might eventually demonstrate to someone.
The “investment risk”, however, is something else. The “investment risk” is that we might not get our money back and a hopeful return above the rate of inflation which, if we don’t get it, is just another way of losing or spending our money. Moreover, it is the “investment risk” that moves markets in a big way – such as in the double digits up or down – as investors suddenly realize that they might not get their money back this year or ever or when they need it (fear), or that they might be missing out on a “grand opportunity” (greed), so to speak, and be left behind or with less money than before.
One would think that buying investments is not a pleasant business and that knowing only the volatility risk would lead to unhappiness and anxiety because such investors have conceded that they really don’t know anything at all about what they’re buying and are merely responding to what is already obvious to everyone else. It’s just a form of “gambling” and akin to “herding” or “ambulance chasing” as if we were lawyers or insurance salespersons looking for business and opportunity in the “low hanging fruit”.
In order to get past that and raise our “investment purchases” above the level of rolling the dice or spinning the wheel or pulling the handle or betting on “Nag One” to win in the fourth quarter, we need to know the “price of risk”, that is, “the least stock price at which a company is likeable” (Goetze 2009) where “likeability” is defined in the provably relevant mathematics and economics by the behaviour of portfolios of stocks each of which is deemed to be individually “likeable” by whatever criteria we choose or fancy.
And that’s the key concept. In the context of “investment risk” – we want to be able to keep our money and obtain a hopeful (but not necessarily guaranteed) return above the rate of inflation – the portfolio (B) of “likeable” stocks should tend not to lose in value and equally importantly (respecting the principles of Ockham’s Razor or lex parsimoniae) the contra portfolio (N) of stocks that we deem not to be likeable should tend not to gain in value. For more details on this, and an explanation of how the “price of risk” can be routinely calculated or estimated from the commonly available data, please see our Posts, The Price of Risk, August 2012, or The Power Principle, December 2012.
It’s fair to say – and we believe that is the experience of most investors – that most professional investment managers to whom we pay fees and salaries and extraordinary bonuses will not guarantee the capital – 100% Capital Safety no matter what – and simply get away with passing on all investment risk whether volatility or systematic to us, the “investment consumers” whether we are retail investors in mutual funds and hedge funds or index funds or sophisticated investors who own trust and endowment funds or pension plans. And economists to whom we might look for an understanding of the really big moves based on economics or monetary or fiscal policy, freely admit (and prove it) that they know nothing at all about stock prices. Please see, for example, Werner De Bondt, What do economists know about the stock market?, The Journal of Portfolio Management, Winter 1991, or nearly any of these Posts on risk aversion. Mr. De Bondt (1991) demonstrated, for example, that “the average forecast has no predictive power and is useless for purposes of investment strategy” and that “economists have had little faith in the random walk theory for thirty-five years” despite the common misunderstanding and reliance on “mean reversion” in virtually all portfolio management affecting multiple trillions of investment dollars for trust and endowment funds and pension plans of all sorts and sizes.
So, what is a girl to do if even the experts don’t know anything? A “girl”, so to speak, with enough money and no current reason to be “selective” or “discriminating” might then just “buy the whole store” and always have the right thing to wear, somewhere, and in investment terms that is not necessarily a completely “off the shelf” policy.
For example, we could have bought 1,000 shares of each of the thirty companies of the Dow Jones Industrial Companies for $1,618,000 in January of last year (2012) and today that portfolio would be worth $1,706,000 for a +5% capital gain ($88,000) and an additional 2% to 3% of cash dividends ($50,000) to spend on groceries and recreation (please see Exhibit 1 below). And, of course, a stock portfolio in the major markets is always liquid and if we need still more money to spend or pay our bills, we would just sell some of our stocks selectively because what was a random situation and a strain on our resources is now a controlled situation supported by our capital and our profits.
Exhibit 1: What’s a girl to do – Buy everything, of course ($000)

There are three investment styles or rules that are demonstrated in the chart.
(Please Click on the Chart to make it larger if required.)
The simplest rule is called “Index” (at the bottom) and is the result of just betting on the Dow Jones Industrial Index which increased by +7% between the end of December in 2011 (12218) to the end of December in 2012 (13104) despite a year of anxiety over the “fiscal cliff”, the USA elections, Eurobond returns and slowing growth in China and elsewhere. “Index Funds” are, of course, a “gold mine” for the vendor because they can buy or simulate the actual index by buying portfolios of stocks that do that, collect our dividends and keep them and also charge us a management fee for that service. What we bought and get to keep is both the volatility risk (please see the month over month percentage Change line) and any investment risk regardless of how much (as in 2008 when the Dow lost 20% of its value in a matter of months). And if we want our money back, well, we did pay a management fee for the whole year, didn’t we, and then there might be early withdrawal fees or loads as well.
An alternative to buying the index is simply buying and owning the stocks of the companies that are in the index (Companies line). The table shows that we could have bought 1,000 shares of each of the companies in the index for (as above) $1,618,000 in early January of 2012 and we would have obtained a return of +5% of capital gains plus an additional 2% or 3% of dividends in the course of the year. The “plan” obviously scales and costs the same to implement (in terms of transactions costs) whether we are buying just 100 shares of each of the thirty companies for $161,800 or a million shares of each for $1.618 billion which purchase is just about “invisible” in the Dow which has a market capitalization of about $4 trillion. Of course, a $200 billion pension plan might be embarrassed if that’s all they did all year – buy 5% of the Dow in January and earn $16 billion in capital gains and dividends by happenstance. Ouch!
Moreover, nothing is guaranteed in either of these plans, neither the capital nor the returns in capital gains although the dividend earnings tend to be reliable and even tend to go up in the “bad” years of endemic capital “losses” which are, of course, only realized losses if we sell the stocks at prices lower than what we paid for them. We note, in passing, that the insurance company “segregated funds” guarantee the capital but might not pay out the dividends and the insurance companies themselves are, for the most part, using their own funds to guarantee the capital when the investment returns turn south.
In order to do better, we need to know more and we can’t just rely on statistics and burgeoning economies to make our money work for us (and not just the portfolio manager). The Perpetual Bond™ portfolio is a managed portfolio that only buys and holds the companies that are deemed to be (B) and which are, therefore, tending to trade at or above the “price of risk” (please see our Post, The Price of Risk, August 2012). Using that rule, we bought only twenty (Count line) of the thirty companies in the Dow in late December of 2011 and early January of 2012 for a cash outlay of $1,250,000 (Total line) and obtained a return of +6% in capital gains and an additional 2% to 3% of earned dividends AND we also obtained 100% Capital Safety and 100% Liquidity using our usual buying and selling discipline (please see our Post, The Wall Street Put, August 2012, or any of the (B)(N) company or portfolio descriptions).
It’s also noteworthy that by being more selective we could buy more of what we want rather than less and just a little bit of everything. Moreover, of these twenty companies, nine were a (B) at the beginning of the year and remained a (B) throughout the entire year and that portfolio which we call The Quintessential Perpetual Bond™ returned +10% in capital gains and a further 2% or 3% of earned dividends. Please see Exhibit 2 and 3 below.
Exhibit 2: The Dow Jones Industrial Companies Quintessential Perpetual Bond – Cash Flow
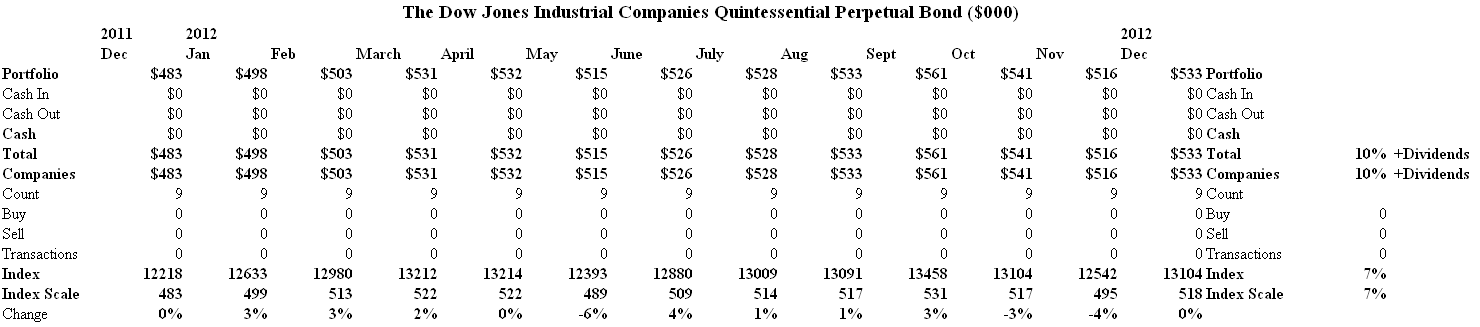
There were no investment decisions affecting this portfolio other than to buy and hold the companies in it as long as they are a (B).
(Please Click on the Chart to make it larger if required.)
We do not know, however, which of those companies in the Dow will do that at the beginning of the year any more than we might know which companies will have the highest or lowest stock prices.
But that’s last year. What can we do for you this year?
In Exhibit 3 below, the nine companies of last year’s Quintessential Perpetual Bond™ are still in the portfolio and the companies in yellow are candidates for new inclusions if the current stock prices or Stock Price (SP) appear to be above the current “price of risk”, the Risk Price (SF). There are just seven of those at the present time, beginning with The Travelers Companies and ending with Johnson & Johnson. In the table, the $GAP is positive for those companies and negative for the others and is the difference between the demonstrated ambient stock prices and the calculated Risk Price (SF).
Exhibit 3: The Dow Jones Industrial Companies Quintessential Perpetual Bond – Portfolio

(Please Click on the Chart and again to make it larger if required.)
The other important columns in the table are the Delta and the $Stop/Loss Price which is our estimate of the reasonably expected downside due to volatility (please see our Post, Popoviciu’s Volatility, September 2012). In general, there is never any hurry to buy or sell stocks for or in our portfolio. We tend to be indifferent to the actual purchase prices because we expect to be holding these stocks for a long time and are buying for dividends and double digit gains (not micro-gains) and the selling discipline allows us to protect the prices that we have while we think about what to do next.
Fortunately, there are other investors who are thinking too and might agree or disagree with us. For example, the vaunted Berkshire Hathaway Incorporated (NYSE symbol BRK.A) is an investment company with total assets of about $400 billion, net worth or shareholders equity of $165 billion, a market capitalization of $130 billion and a current share price of $140,000 per share that has never paid a dividend but generally insists that others do. Among the stocks that they own, we don’t “like” KO Coca-Cola Company (please see Exhibit 3 above) at the present time but it’s 20% of their portfolio and they own 400 million shares ($15 billion) of it. On our “like” list, however, they also own 67 million shares of IBM, 151 million shares of American Express, 52 million shares of Proctor & Gamble but have recently reduced their holdings of JNJ Johnson & Johnson (which is on our “like” list) from approximately 60 million shares in 2007 to less than 500,000 shares and have been selling them at, apparently, a small aggregate loss of about minus ($600 million) to their portfolio last year (Forbes, November 16, 2012, Warren Buffett Buys More Wells Fargo and IBM, Sells Johnson & Johnson).
Our information base regarding JNJ Johnson & Johnson is quite different from theirs and we’ve been pleased to hold it in the Perpetual Bond™ since early last year. Please see Exhibit 4 below.
Exhibit 4: (B)(N) JNJ Johnson & Johnson – Risk Price Chart

Johnson & Johnson is a holding company which is engaged in the research and development, manufacture and sale of a range of products in the health care field.
(Please Click on the Chart to make it larger if required.)
The Risk Price Chart (Exhibit 4 above) shows that we bought and held Johnson & Johnson between $50 and $60 in early 2009 through mid-2010 (Red Line which is the Stock Price (SP) above the Black Line which is the calculated Risk Price (SF) both of which are step-functions) for no other reason than that the ambient stock prices appeared to be at or above the price of risk. We also bought it again in early 2012 at $64 and hold it now at $71 for a capital gain of about +7% and earned dividends of $2.40 per share (please see Exhibit 3). In addition, the company pays almost $6.8 billion per year to the shareholders for a current dividend yield of about 3.4% which is above the rate of inflation. Our estimated downside due to volatility is minus ($3) but we can also lock in our price at no less than $70 and no more than $75 for the next three months for a net cost of less than $0.80 per share today. For example, the March put at $70 is $0.96 per share and the short or sold call against our long position at $75 is worth $0.20 per share (please see our Post, The Wall Street Put, August 2012, for more details on how we protect our stock prices).
In contrast, however, we are not prepared to buy and hold KO The Coca-Cola Company at the present time although we have owned it at various times in the past. Please see Exhibit 5 below. The current Risk Price (SF) is $37 and has been rising from $35 earlier last year whereas the current ambient stock price appears to be less than that and has a volatility-based downside of minus ($2). We also note that the company was in the “trading range” (N) between $30 and $35 for nearly two years beginning in late 2010 and we did not own it for the same reason and no other – the ambient stock price appeared to be below the demonstrated Risk Price (SF).
Exhibit 5: (B)(N) KO Coca-Cola Company – Risk Price Chart
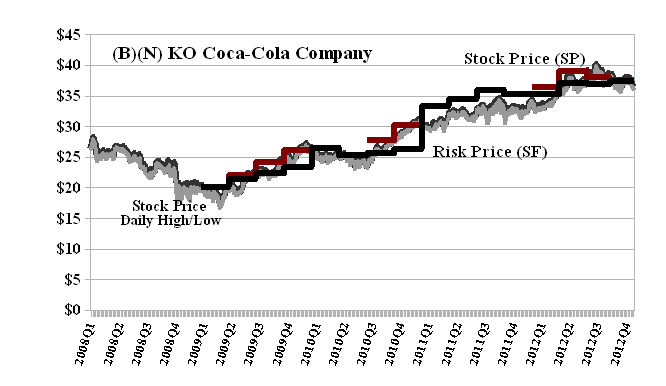
The Coca-Cola Company is a manufacturer, distributor and marketer of non-alcoholic beverage concentrates and syrups in the world.
(Please Click on the Chart to make it larger if required.)
We have shown elsewhere that the “price of risk” and the “stock price” demonstrate or obtain a Nash Equilibrium in the context of investment risk management. Please see our Post, The Nash Equilibrium & Its Stock Price, October 2012. That, indeed, is quite a lot for a girl to know.
Postscript
We are The RiskWerk Company and care not a jot for mutual funds, hedge funds, “alternative investments”, the “risk/reward equation” and every other unprovable artifact of investment lore. We have just one product
The Perpetual Bond™
“Alpha-smart with 100% Capital Safety and 100% Liquidity”
Guaranteed
With No Fees and No Loads on Capital
For more information on RiskWerk, please follow the Tags or Categories attached to this Letter or simply enter Search for additional references to any term that we have used. Related data may be obtained from us for free in a machine readable format by request to RiskWerk@gmail.com.
Disclaimer
Investing in the bond and stock markets has become a highly regulated and litigious industry but despite that, there remains only one effective rule and that is caveat emptor or “buyer beware”. Nothing that we say should be construed by any person as advice or a recommendation to buy, sell, hold or avoid the common stock or bonds of any public company at any time for any purpose. That is the law and we fully support and respect that law and regulation in every jurisdiction without exception and without qualification to the best of our knowledge and ability. We can only tell you what we do and why we do it or have done it and we know nothing at all about the future or the future of stock prices of any company nor why they are what they are, now. The author retains all copyrights to his works in this blog and on this website. The Perpetual Bond®™ is a registered trademark and patented technology of The RiskWerk Company and RiskWerk Limited (“Company”) . The Canada Pension Bond®™ and The Medina Bond®™ are registered trademarks or trademarks of the Company as are the words and phrases “Alpha-smart”, “100% Capital Safety”, “100% Liquidity”, ”price of risk”, “risk price”, and the symbols “(B)”, “(N)” and N*.
