The “Birds of Prey” Perpetual Bond
The “Birds of Prey” is a Perpetual Bond™ with domain that consists of the companies in the major stock markets that can be said to “eat every day” and whatever it is that they’re doing with the foods, nuts and bolts of the economy, they’re doing it well enough that investors keep bidding up the price of their stocks. Unfortunately, that can make it look easy to make lots and lots of money in the stock market with no apparent risk and, as we say,
The Perpetual Bond™
“Alpha-smart with 100% Capital Safety and 100% Liquidity”
Guaranteed
With No Fees and No Loads on Capital
But it’s not easy. Investment is just and only the “purchase of risk” and there is always more risk than money to go around and one ought to know the price of it, that is, we ought to know the “price of risk” if “risk” is what we’re buying. (Please see almost any of our Posts, such as Adrift and Starving on the Risk Appetite, July 2012 or Numbers 20:12, August 2012 or The Price of Risk, August 2012.) Alice (in Wonderland, of course) might think that she’s buying a piece of the economy that will grow in value – that might be true, but right now she’s just a stock holder and the price of that has less to do with the future performance of the company, doing what it does so well, than whether other investors will want to buy the stock that she has at a higher price in a market that has thousands of stocks and tens of thousands of investors with many different motivations in an uncertain economy. In our jargon, a Stock Price (SP) that is trading above the Price of Risk (SF) is a “free good” and that gap is one that begs to be closed. Please see our Post, The Price of Risk, August 2012.
The Birds of Prey is, therefore, an actively managed portfolio of stocks and we must expect to actively “buy” and “sell” company stocks based on our apparently simple rule that a company is in the portfolio if and only if the current Stock Price (SP) plausibly exceeds its current Price of Risk (SF) (please see Exhibit 2 below for current examples) and we only buy companies when there is a transition from (N) to (B) where the (N) companies are trading at below the price of risk (and, therefore, are not (B)) in a range of prices that can be accurately described as the “volatility zone” and the zone of “investor uncertainty” (N). We also “sell” the stock when there is a transition from (B) to (N).
There’s a great deal of new theory (Goetze 2009) in both mathematics and economics that suggests and supports that rule and our practical experience in the real and active markets has shown that the rule is, in fact, actionable and effective – that is, the theory is verified by data, which is seldom the case in (ah) “real” economics. For more on this, please see our Post, The Price of Risk, August 2012 and our notes on the “selling” discipline, The Wall Street Put, August 2012.
The Birds of Prey portfolio can be constructed in any of the major markets (please our recent Post, The “Quintessential” Perpetual Bond, September 2012) but with the goal of “food chain” in mind, we have restricted it to the companies of the S&P 500 NYSE that (1) pay dividends (therefore, we can eat regularly too) and (2) have been (B)’s for at least the last nine months (since December 2011 and often longer).
Exhibit 1: The Birds of Prey Perpetual Bond – Cash Flow
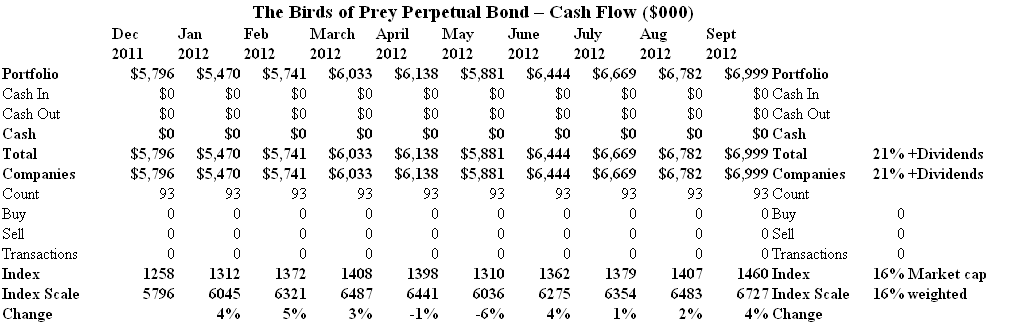
The Birds of Prey Perpetual Bond – Cash Flow
(Please Click on the Chart to make it larger if required.)
This portfolio (Exhibit 1 and 2) of ninety-three stocks in the S&P 500 NYSE companies has been unchanged since late December (no transactions) and has returned +21% so far this year plus dividends which will add another 2% to 3% to our returns. In our usual notation, we bought blocks of 1,000 shares in each of the companies that were a (B) in late December and early January (and there were more than ninety-three of them but we focus here only on the “survivors” in order to think about what might happen in the future, knowing what we know now) at a cost of $5,796,000 which is now worth $6,999,000 at the end of September (Portfolio, Cash and Total Lines). If we do nothing else this year but set the stop-loss prices (please see the $Stop Loss column in Exhibit 2) we can expect no less than $6,362,000 if the market completely collapses and we’re sold out of everything. But, of course, that’s no way to manage a portfolio (please our recent Post, Churn, Churn, Churn, September 2012). For example, although the problem is not entirely unpleasant, what are we to do with all that cash (we need more (B)’s to buy), and what about the tax consequences for this year, and what about the survivors which are still in our portfolio and still (B) at even higher prices?
Exhibit 2: (B)(N) The Birds of Prey Perpetual Bond – Portfolio
(N) The Birds of Prey Perpetual Bond - Portfolio")
(Please Click on the Chart once and then again to make it much larger if required.)
If we wait for (B) to (N) transitions in every case, then the portfolio will eventually be sold out at $5,580,000 for a significant loss (please see Exhibit 2, September (SP) and (SF) columns) unless the risk price is rising which we won’t be able to confirm until new balance sheets become generally available for these companies at the year-end and as late as March next year.
For example, SNA Snap-On Inc, has been in our portfolio since $25 in 2009 and is presently in our portfolio at $73 (up +45% since December) with a risk price of $55 and a stop-loss price of $64 (please see Exhibit 2). The company has a market capitalization of $4.2 billion and will pay a dividend of $1.36 this year. It’s clear that in the past we could take profits between $50 and $60 or, as indicated, simply keep the stock and “protect” the price across volatility and investor uncertainty or other needs by buying puts and selling calls against our long position. For example, we can buy (today) a $70 put in March 2013 (six months from now) for $4.30 per share and sell an $80 call for the same date for $1.80. Hence, for a net cost of $2.50 per share today we can lock in a minimum of $70 per share for the next six months (while we ponder and wait for new information) but we might be sold out (“called”) at $80 (oh well) and both the put and the call can be traded and/or rolled forward at different prices and times during all of that time while we decide whether to sell or keep the stock in our portfolio. It is also noteworthy that nobody said in January that Snap-On would run from $50 to $73 this year. For more on how we deal with our brokers, please see The Wall Street Put, August 2012.
Exhibit 3: (B)(N) SNA Snap-On Inc – Price Chart
(N) SNA Snap-On Inc")
(Please Click on the Chart to make it larger if required.)
On the other hand (and this applies cogently to our current crop of (B)’s), things can also go south rather quickly. BIG Big Lots Inc (please see Exhibit 4) has been in our portfolio since $25 in 2009 and we sold it out at $40 this year on a confirmed (B) to (N) transition in July. It’s also noteworthy that both the Stock Price (SP) (Red Line) and the Risk Price (SF) (Black Line) are step-functions, constant for some periods of time – the Stock Price (SP) because its values reflect our “buying” and “selling” discipline and the Risk Price (SF) because no amount of evolving (daily) stock price information will change its value absent new balance sheets.
Exhibit 4: (B)(N) BIG Big Lots Inc – Price Chart
(N) BIG Big Lots Inc - Price Chart")
(Please Click on the Chart to make it larger if required.)
For more information, please follow the Tags or Categories attached to this Letter or simply enter Search for additional references to any term that we have used. Related data may be obtained from us (for free) in a machine readable format by request to RiskWerk@gmail.com.
Disclaimer
Investing in the bond and stock markets has become a highly regulated and litigious industry but despite that, there remains only one effective rule and that is caveat emptor or “buyer beware”.
Nothing that we say should be construed by any person as advice or a recommendation to buy, sell, hold or avoid the common stock or bonds of any public company at any time for any purpose. That is the law and we fully support and respect that law and regulation in every jurisdiction without exception and without qualification to the best of our knowledge and ability.
We can only tell you what we do and why we do it or have done it and we know nothing at all about the future or the future of stock prices of any company nor why they are what they are, now.
The author retains all copyrights to his works in this blog and on this website. The Perpetual Bond®™ is a registered trademark and patented technology of The RiskWerk Company and RiskWerk Limited (“Company”) . The Canada Pension Bond®™ and The Medina Bond®™ are registered trademarks or trademarks of the Company as are the words and phrases “Alpha-smart”, “100% Capital Safety”, “100% Liquidity”, ”price of risk”, “risk price”, and the symbols “(B)”, “(N)” and N*.
